Welcome to Solar Sun-day, not posted Sunday -- (Dad joke, get it haha?) While I did work on the generating the stats this weekend and painting the conduit / panels for the new Solar power system this post is mainly about some statistics from the new system. For a description and pictures / drone video of the system install, visit my earlier post here:
@ksteem/weekend-solar-install-with-battery
As just a quick review, we installed a 32 panel system rated at 13kWh, and 4 Enphase Battery Backups.
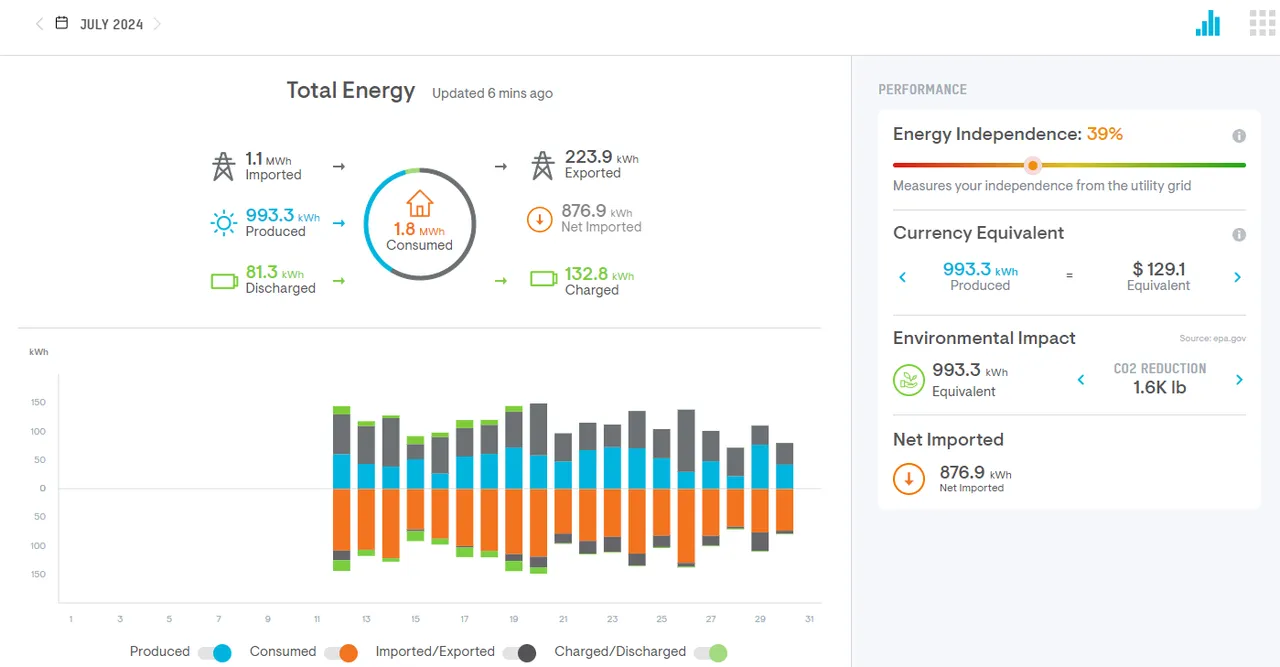
This shows the overall production for the Half Month (July 12-30th). In that time period, we've used (Consumed) 1.8 MWh (1,800 kWh), pictured in Orange on the graph. In that same time, our Solar Panels have produced 993.2 kWh, or about half of what we've used (shown in Blue). We also powered the house off of our backup batteries for about 81.3 kWh shown in green, and charged the batteries for about 132.8 kWh. We also exported 223.9kWh back to the Power Company grid.
I'll have to wait a couple weeks to see how this actually impacts our monthly bill, but based solely on electric cost, it should shave at least the $129.10 shown here off the bill, maybe more. Hopefully double that amount or more in a full month.
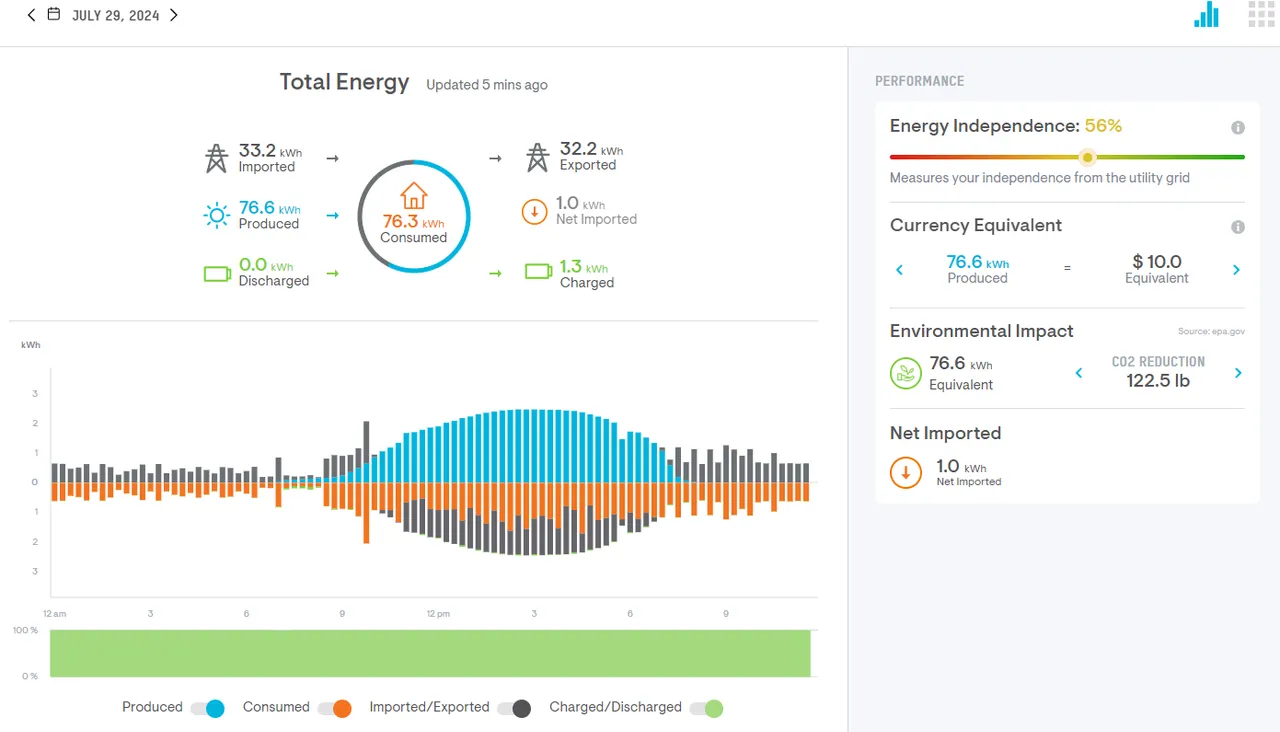
This is a shot from one of the better days with full sunshine nearly all day. We actually produced more energy than we used, even including the nighttime hours with no sun. You can see the nice pretty blue curve of Solar production ramp up in the morning full strength in the early afternoon and then go back down in the evening. Keep in mind, we are in one of our three top consumption months (July, August, Sept) here right now with Air Conditioning running hard. Daytime temperatures running around 95F (35C) during day and 80F (26C) at night. We'll likely see some days over 100F (37C) next month. It's also the storm season for us with clouds and thunderstorms many days over the last 2 weeks.
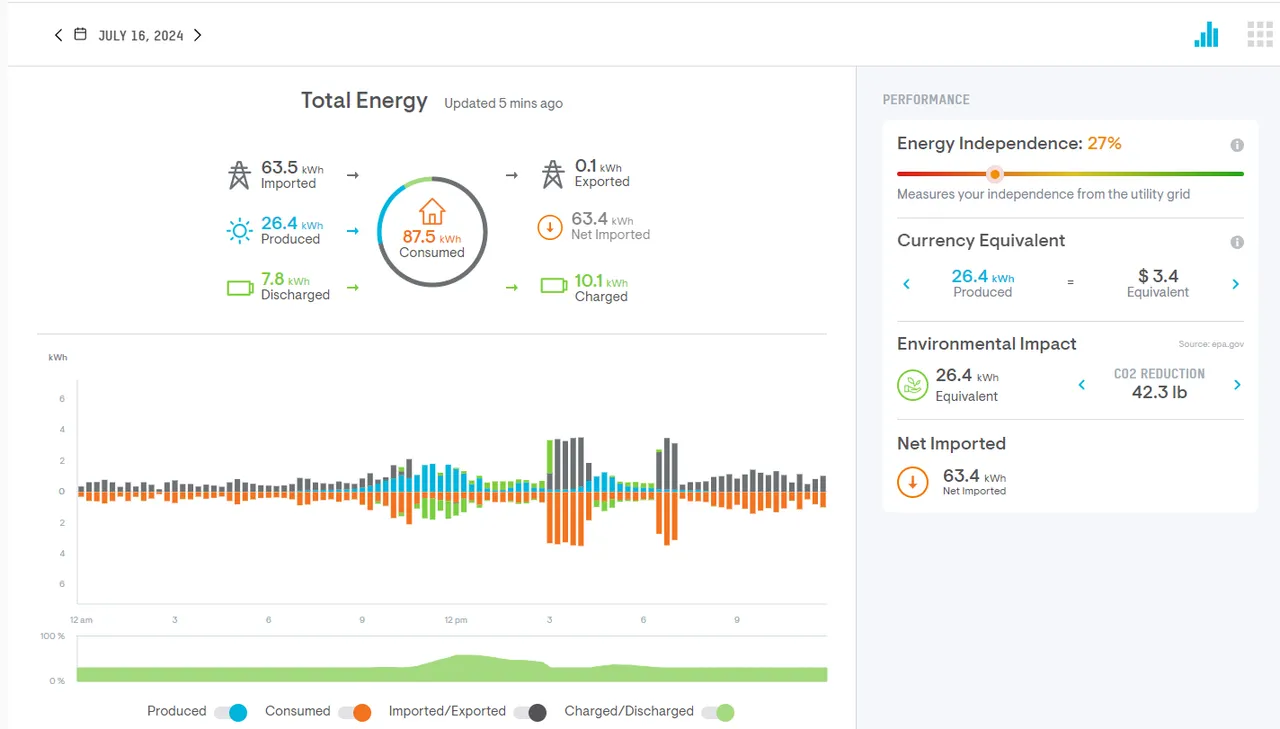
Below is one of the least productive days, with rain and clouds nearly all day. Only produced 26.4 kWh all day. Very sad.
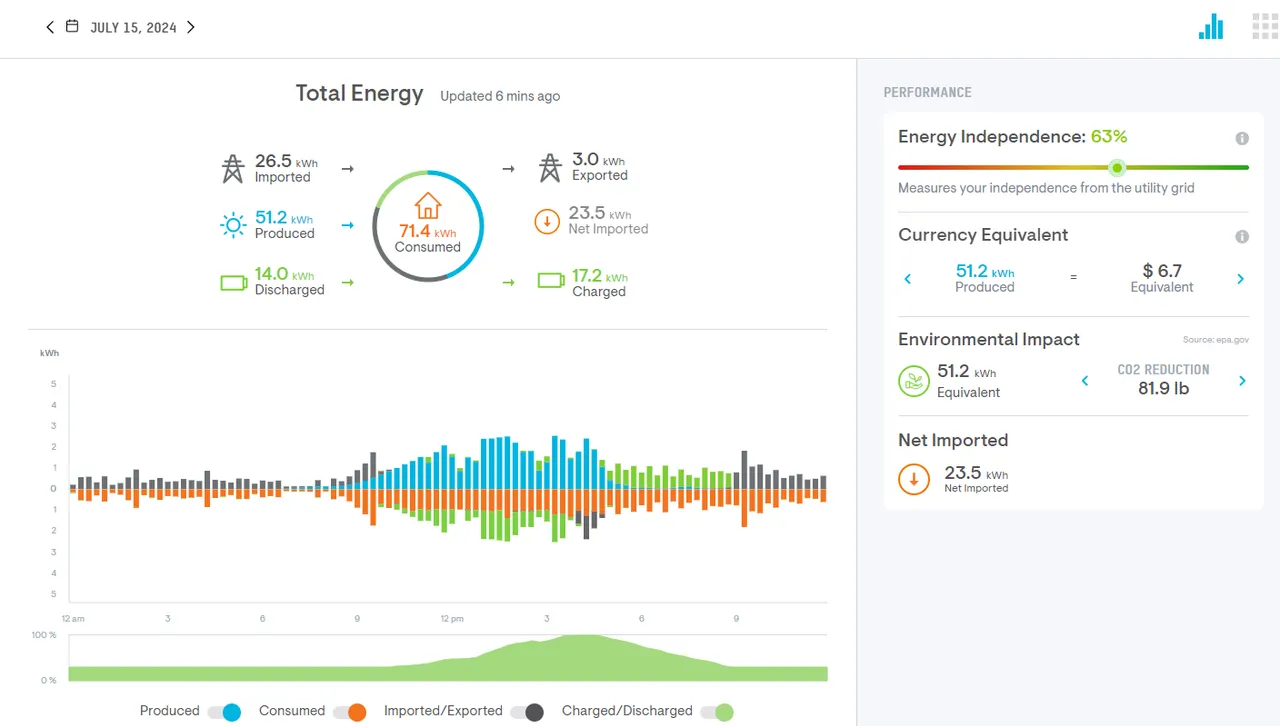
This day below was more interesting. In this shot, I was letting the Solar charge the backup batteries during the day (green below the line), and then using them to power the house for several hours in the early evening. You can see all the dips in the blue during the day from clouds and storms, then running off battery from about 5pm to 9pm (about all the backup we got that day with the AC running, and other usage.
In this shot below, it shows what happens when we drive 200 miles and then charge the Chevy Blazer EV. You can see the big spike in the orange around 2-5pm, and also can see that we were using both Solar (blue) and the backup batteries (green upper) to charge the car without pulling from the grid (black upper). This was cool, but actually left the house batteries down for the night so glad we didn't have outage!

I've been watching the stats a bit obsessively and even changing some of our scheduled things to use during solar production (pool filter, clothes washer/dryer etc.) What we found is that we are typically using about 2-3 kwh for the always on stuff like refrig, freezers, water heater, computers, clocks, etc.... about 5-7 kwh when the AC quilting machine, and other daytime stuff in use and about 14-15kwh when the car is charging or clothes dryer running also..
Lessons learned:
I really thought I had over-sized system enough to account for the car charging. Not near as much as I had thought. I think we still may come out with net overage for the year, but we're certainly not going to cover the entire consumption during this hot and stormy months. But if we can get this close in these months, the other months when we don't need AC should make up extra.
I also learned that there is a built-in safety buffer on the systems.. ie: even though our system is rated at 13 kWh, the max I've seen it actually produce is about 10-11 kWh.
I definitely knew that we were not going to be producing power early morning and nighttime, but due to the position of our roof and panels, it ramps up really slowly in the morning producing only a few kWh until just after noon, when it kicks into high gear until about 6pm. I could likely pick up some additional good hours if I placed another 8 panels on the other roof slope to catch the morning sun, but not sure I'll do that or need to. Will re-evaluate next year.
I definitely did not take into account the impact the clouds would have. Even the spotty white puffy clouds will drop the production dramatically 5-8 kWh when they pass over. I'm fairly new to this area in Florida, and didn't know the afternoon thunderstorms were so frequent. These are pretty sporadic and generally only last 2-3 hours of clouds before they blow over, but it definitely impacts my production! More that my typical buffer for unknowns that I factored in.
I really like the Enphase app and all the information it gives me. Besides these graphs that are updated every 15 minutes, it also has a realtime view that shows me where the power is coming from and going to with changes every second. I have to confess, I've spent more time monitoring this thing and turning things off and on than I care to admit. Not sure if it will show up, but I tried an animated gif that shows the power flow switching from consumption and charging the backup batteries to also feeding back to the grid. Way cool to see it live.
Feel free to comment or questions. I'm no expert (yet), but I am learning a lot!
Enjoy!