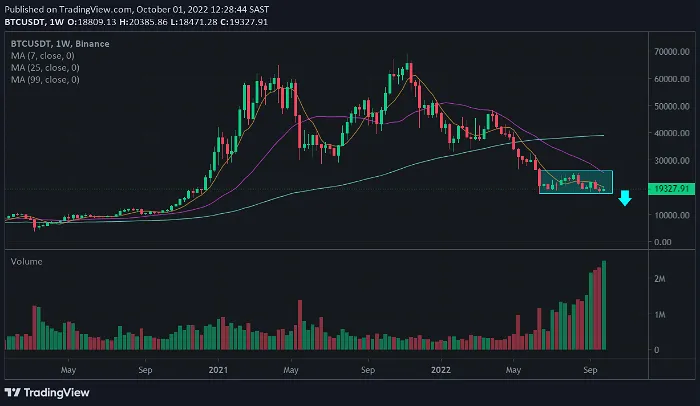
While everyone has become rather frustrated in regard to the Bitcoin price, there is another element of this story that may not necessarily be that obvious, especially to those who do not understand or practice TA. What has been perceived as “boring” and frustrating is actually turning out to be the formulation of “weakness”. As I mentioned in a recent article, the $19K to $20K level is beginning to wear thin. The more often you return to a level of support, the more validation it receives as “meaningful support”. Unfortunately, it is a bit of a two-edged sword, as it simultaneously becomes weaker. When looking at the charts, you will also be able to note that the range has become compressed. Bitcoin has been trading in a tight range for a few months now, and I believe is moments away from a significant move.

Image Source – Binance.com
As you can see in the chart above, the range is extremely tight. Furthermore, BTC is currently trading at the bottom of the range. It is not likely that the price action moves higher, so as to “escape” this range. In other words, if it were to move higher, it is likely to simply be rejected, once again. It is also important to note that the volume has been absolutely surging while the price has been falling from the $25K mark. As I have pointed out previously, volume moves and sustains “moves” in the market. The volume is telling us that the current bias is bearish, despite many expecting October to be bullish. On that point, I definitely wouldn’t eliminate bullish price action in October. However, I personally believe that it is a case of “down then up”.
Quite Similar
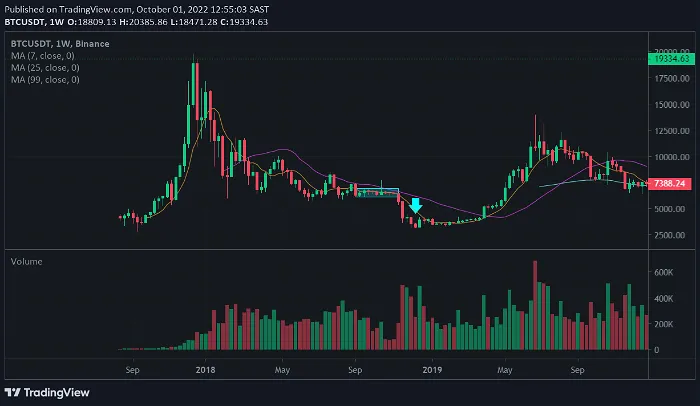
Interestingly enough, we had a very similar “formation” in the previous bear market. Looking at the chart below we are able to identify a very similar pattern. Just prior to the final capitulation event was a very similar period of “tight trade”.

Image Source – Binance.com
