Messari researcher Mira Christanto posits on Twitter that, if bitcoin's current rally were similar to that of 2017, we would be at a point in time equivalent to July 2017, i.e. six months away from a new all-time high. It also predicts, based on expected percentage growth, that the likely price of bitcoin in December will be $292,000.
The current bitcoin bull cycle would have started at the low point the cryptocurrency reached in December 2018, in the vicinity of USD 3,400. That is the starting date proposed on her Twitter account by Messari's researcher, in which several bitcoin market analysts agree.
Another premise of this scenario is that the starting point of the 2017 rally was in April 2015 and that it peaked in December of that year. The price of bitcoin multiplied by a factor of close to 100 with respect to the starting price, according to the period considered.
In the following graph of the bitcoin price, the two bullish cycles used in this hypothesis are highlighted with colors. In this graph, it is assumed that the current cycle has not concluded. For Messari, if the BTC price were to remain attached to the evolution of the bitcoin boom between 2015 and 2017, the price would approach USD 300,000 by the end of the year.

The circumstances surrounding the two cycles, however, are different, and no arguments are presented to support that a development based on past historical data can be repeated.
After the first two bitcoin halvings, bull runs in the price were initiated, with different returns at the time of peaking and with different start dates after each reduction in the miners' reward occurred.
The current cycle, which began about 10 months after the third halving, departed from some of the hypotheses formulated on the basis of what happened after the previous halvings.
Analyzing the first two halvings, it can be determined that, while the bitcoin rally began almost immediately after the first halving, which occurred on November 28, 2012, the cycle following the second one took more than a year to start. The return of that first cycle at the end of 2012 was 60 times, while in the bull cycle following the second halving, the price increased 30 times.
In light of what happened with the third halving, on May 11, 2020, the bull cycle would have already started the previous December, according to the thesis already discussed, while the March 2020 fall was only a delay in the progress of that cycle.
An Ecoinometrics analysis of September 2020, which uses the same technique of superimposing different price evolutions over time used by Christanto, suggests that the price of bitcoin after the third halving would be circumscribed between two bands. These would be the one marked by the percentage evolution after the first halving (upper cap) and the evolution after the second (lower cap).
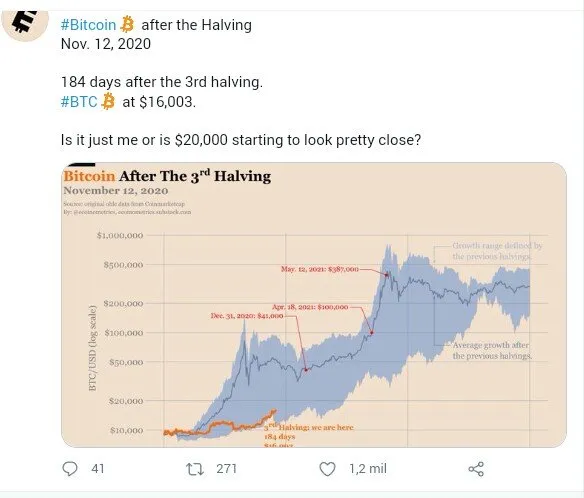
It has been 9 months and three days since the third halving and Ecoinometrics updated the graph presented last September, which allows to see the actual evolution of the bitcoin price within that band.If instead of sticking to the 2017 pattern, the bitcoin price would follow an evolution close to the average price between the curves marked by the first and second halving, Ecoinometrics calculates that, by April 18, the BTC price would be USD 100,000.
Mira Christanto's prediction is not far from what Ecoinometrics forecasts for the end of the year. This analytical firm calculates that bitcoin will end the year with a price very close to the USD 286,000 it will reach in October 2021, if it remains on the average curve between the evolutions of the first two halvings. On the other hand, analyst Willy Woo has also suggested a price close to USD 200,000 for December this year, although he does not rule out that it could reach USD 300,000.