I love technical analysis and firmly believe that a thorough technician can use it to gain an edge over the market beyond gut and discretion.
Besides, when it comes to the forex market, it's actually almost all you have to work with.
There's of course fundamentals such as interest rate and inflation expectations, GDP and trade data etc, but the market will often run contrary to fundamental sensibilities for months at a time, so in the short term, techs are all you have to go off.
This is because the forex market is simultaneously decentralised and opaque - a few brokers are semi-transparent with their orderbooks and positioning data - but most aren't.
Conversely, stock exchanges are inherently centralised, but relatively transparent - stock and index traders have a lot more internal data to work with and successful systems traders can leverage this data to improve their technical systems.
How does this relate to blockchains and Hive?
Well, though Hive and blockchains in general are decentralised like the forex market, unlike the forex market they are incredibly transparent - there is a treasure trove of data readily available to anyone with the technical know-how to query the chain.
Even if you wouldn't know an API from the DMV, there's an abundance of people who do have that knowledge and share data and insights publicly.
In the case of Hive we have @Penguinpablo who has been publishing valuable stats about the blockchain since the days of Steem.
Hodlers and Pumpers
Broadly speaking, there are two distinct groups of people who drive price higher - stakeholders and short-term traders.
The latter group are inherently fickle, they have no to very little interest in a project, they are buying only to capitalise on short term opportunities.
As such, the long term success of a project in terms of price comes down to the first group of people, the stakeholders.
Net Powerdown
So what are the stakeholders doing?
Let's take a look at a chart from our Antarctic friend's latest weekly stats post:
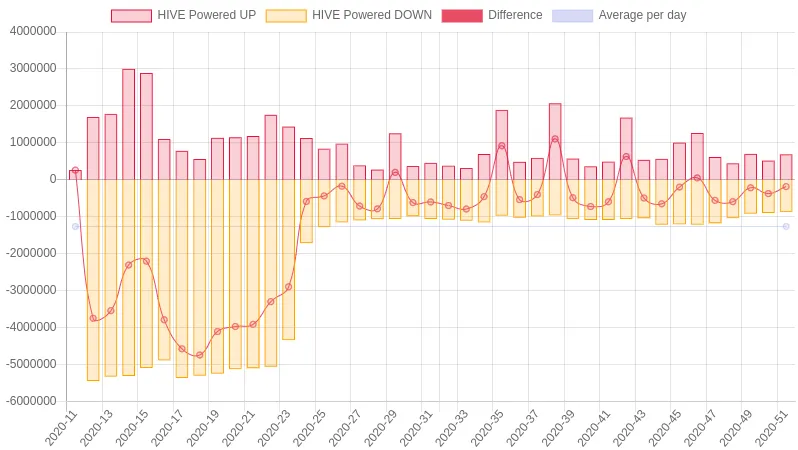
(Credit: @penguinpablo)
This chart shows the amount of Hive powered up and down, week by week, as well as the net result or "Difference" (red line) - this difference is what we're interested in.
As you can see, since network inception, the vast majority of weeks have resulted in a net powerdown. Over 40 weeks of data, we only see a net powerup on 6 occasions.
Where there's smoke, there's a net dumpster fire
Now the above phenomenon in isolation doesn't necessarily mean there's more money leaving the network than coming in eg stakeholders burnt by 13 week powerdowns in the past could be opting to hold the more nimble liquid Hive, or they could be using liquid Hive to make markets on HBD, Steem Engine etc
Let's take a look at another one of Pablo's charts:
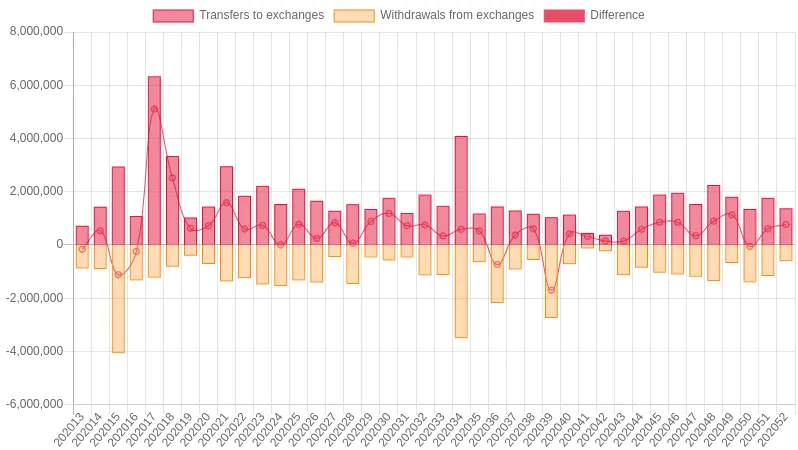
(Credit: @penguinpablo)
This chart shows net transfers to and from exchanges, and once again, the difference between the two, represented by the red line.
Note the way this one has been laid out is a little different to the previous chart, as the behaviour pattern that is bad for the network is represented as a positive number rather than a negative.
This chart confirms what we inferred already from the previous chart, overwhelmingly there is more Hive being sent to exchanges than there is coming in from exchanges.
I saw a comment in the stats post along the lines of people are holding it on exchanges waiting to sell a rally - given 3s TX times and the bearish trend, I don't put much stock in that - this is Hive being net dumped by the community, week in, week out.
Wen moon?
As long as the above trends continue, Hive can't possibly moon.
Sure it may get pumped by short term traders every now and then, but as long as stakeholders are behaving more like traders, with a focus on short term gains rather than the long term health and wealth of the network, the trend in price is obviously going to be down.
The bright side
The good news is net powerdowns are no where near as large as they once were, the difference in the last week of data was 180 000 HP, roughly $20 000 USD.
If the community had powered up 30% more liquid Hive, we would of had a net powerup.
If the community had powered down just 25% less HP - net powerup.
The difference in net exchange transfers was substantially larger at 780 000 HP, roughly 80K USD and a substantial sum of money, but not huge in the bigger scheme of things.
If the community had bought twice as much Hive we would have had net inflows.
If the community had sold 60% less Hive - net inflows.
Food for thought
If all stakeholders; witnesses, investors, authors, devs etc just took a little bit less from the network each week, gave a little more where possible, we would be positioning the network for serious long term success.
Just 4 new investors buying 20K USD worth of Hive each and powering up would of led to net inflows and powerups too, but can we really expect new stakeholders to come in when we are actively sabotaging our own existing stake?