Good day Hiveians!
Join me in analyzing the crypto markets!
In 2020 I made one of my best predictions regarding the stock market
On February 22nd just before the big Corona crash I made a post pointing to the similarities of the much bigger stock market crash of 1929. Only several weeks later we had the anticipated correction (in fact we were already in the midst of it).
This is 1929:

And this was February 2020:
However, as we all know it wasn't the big crash. Since 2020 the market has had its fastest recovery on record and we are back to all time highs. But the point I want to stress here is that it was possible to anticipate such a big correction through fractal analysis.
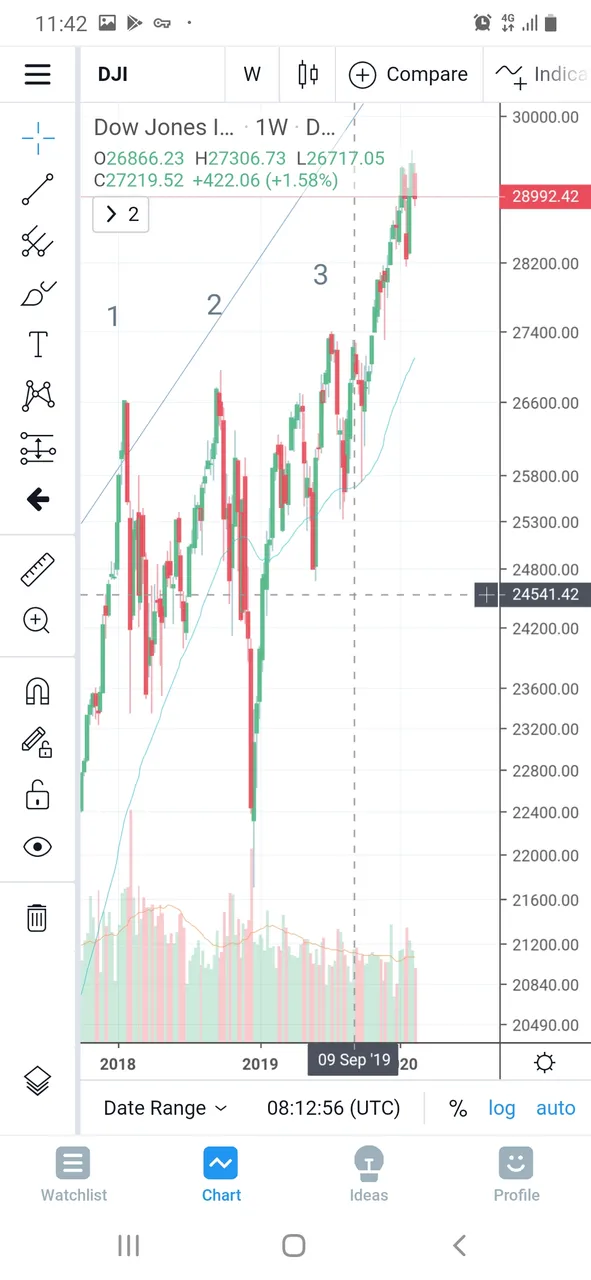
If we look at the DJI index the fractals are now so obvious it is hard to miss them and I think they are once again pointing to a correction. In fact I think it might be the big one.
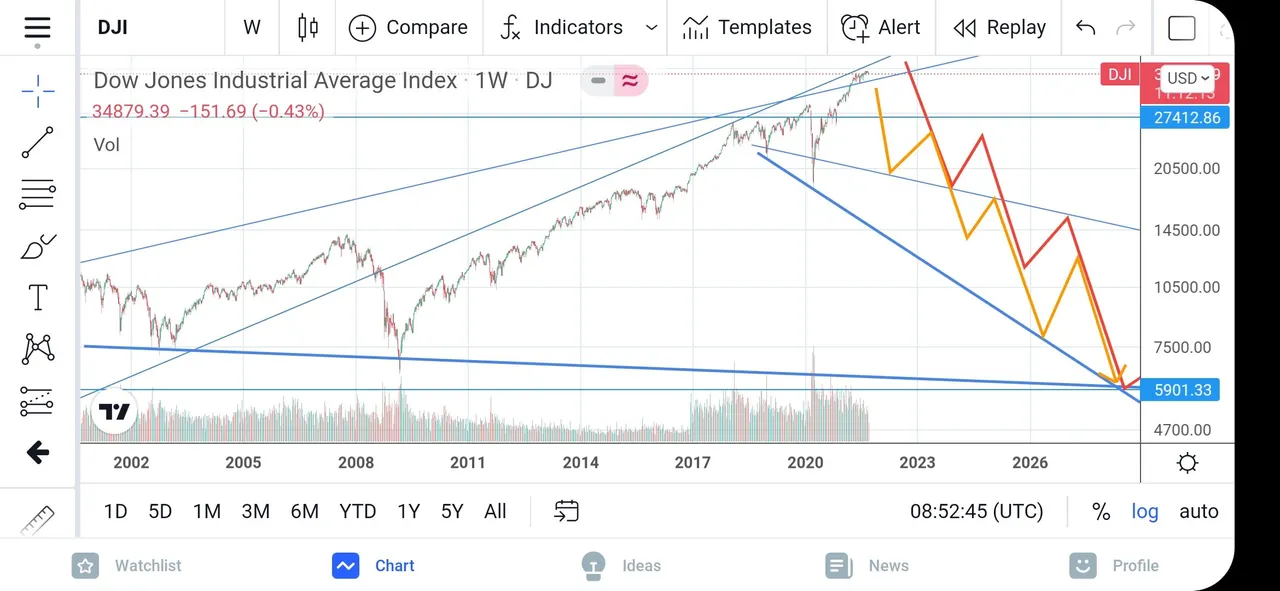
TA suggests a massive corrective potential all the way down to 6k(!) While this is only one of many possibilities, I don't think it is completely implausible.
Especially considering the world situation now with covid sill lingering around and the potential of millions of Americans putting down their jobs over the vaccine. Not to mention the explosive geopolitical situation... But let's get back to the TA.
Sorry for he bad charts (I am posting from my phone)
I think the most dominant fractal is the one circled in the chart here (showing only the fist 2 segments). I have also drawn it marked with 3 segments. The first one is an upward movement followed by a relatively small correction. The second one is an upward movement that precedes the first upward movement and is followed by a stronger correction. And the third phase is a longer upward movement that takes prices to new highs. This is the basi pattern that is identifiable throught the decades. Note that it differs somewhat from the pattern in the early 20th century.
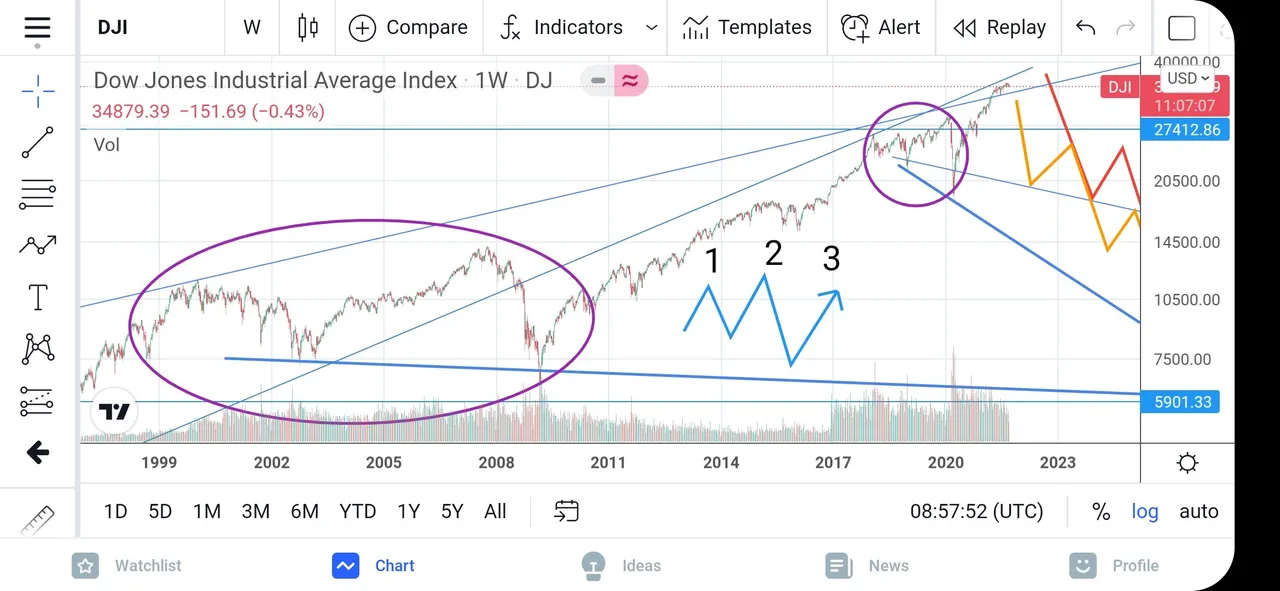
The second characteristic is a double peak. It is visible before the corona crash at the top. On a larger scale the corona crash could be the divisor for the two peaks which would mean that the latest rally would be the final peak.
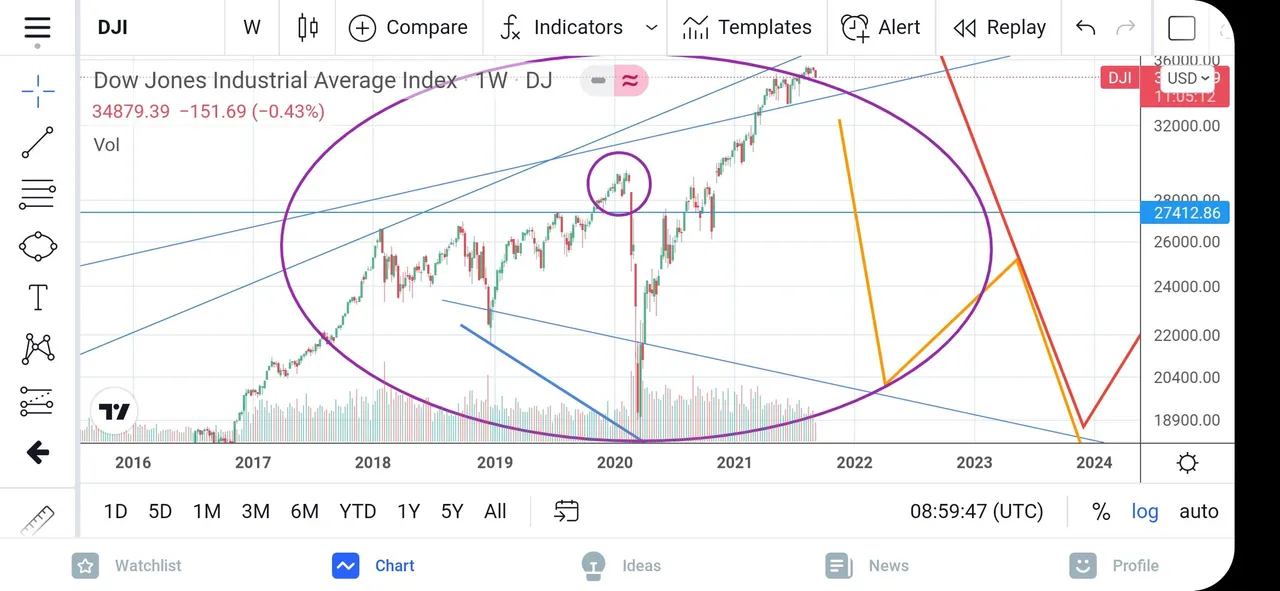
Since this would be a correction on the macro scale it would be big. The dot com crash as well as the financial crisis of 07/08 would be the fractal precursors for the big one. If we extend the trend lines from these crashes ad well as the most recent ones we get a convergence at around 6000 points. However, the time period for this is fairly long, possibly taking 3 to 7 years to unfold. Although this scenario seems like quite a stretch currently, I think we shouldn't write it off just yet.
As a general reminder: Please keep in mind that none of this is official investment advice! Crypto trading entails a great deal of risk; never spend money that you can't afford to lose!


Check out the Love The Clouds Community if you share the love for clouds!