Everyone has their own strategies, favorite indicators, patterns, etc when it comes to trading markets. Many 'influencers' and 'gurus' will tell you know have that magic sauce and that they know exactly what the markets are going to do! All you have to do is attend the free webinar where they sell you a course, lol. Well the dude doesn't abide by that, lol.
I am going to tell you here and now what has changed my game what my new secret sauce is. In the now 4 years of learning and studying these markets, I have seen every indicator known to man and machine, lol, at least it feels that way. I have used and traded with many of them, some having luck, some not so much. I even tried trading bots like Cryptohopper and 3 Commas to try and take the human emotion and just trade by rules, well I ended up going in an messing with the bots too much that I might as well have just traded it myself, lol.
Back To Active Trading
I am putting yield farming aside for now, and getting my focus back into active trading and portfolio management. I looked at the fact that the fact that the crazy events recently in the DEFI and CEFI world in that Terra LUNA and UST absolutely crapped the bed, taking 5 figures of my portfolio and over half of my daily income with it, and then recently with Celsius basically going under, luckily I wasn't involved with that, but this has made me really look again at trading vs yield farming. I could have shorted these drops instead of having my time locked yield farms melt before my eyes and cannot do anything about it.
So it's back to the good ole buy low sell high! I have been wanting to step up my game and figure out the best tools that I can use, without any costs, cause at this point, I am Po'... Like going straight past Poor, all the way to bread and bologna Po' boy, lol. I have a small amount that I have been able to trade up and I am really excited at my new strategy.
My Chat With A Professional Trader
This information didn't come from any youtuber, which I have found some great content after I started studying, but, I had the honor to be able to sit down recently with a professional institutional trader and he gave me the run down on how they trade...
I'll tell you too, they aren't using any of the lagging indicators that the retail traders are using. The strategy he taught me is incredibly simple and easy to learn. Of course you will want to confirm with other indicators and such as well, but there is really just 2 tools that when he really broke it down to me, made more sense than anything I have heard before...
He really showed me two methods that he uses in combination, but I am going to talk about the main one today, gotta save some juicy stuff for you to come back for, haha. So are you ready to know what that is? Well you can can pretty much take a wild guess from the title of the article, lol...
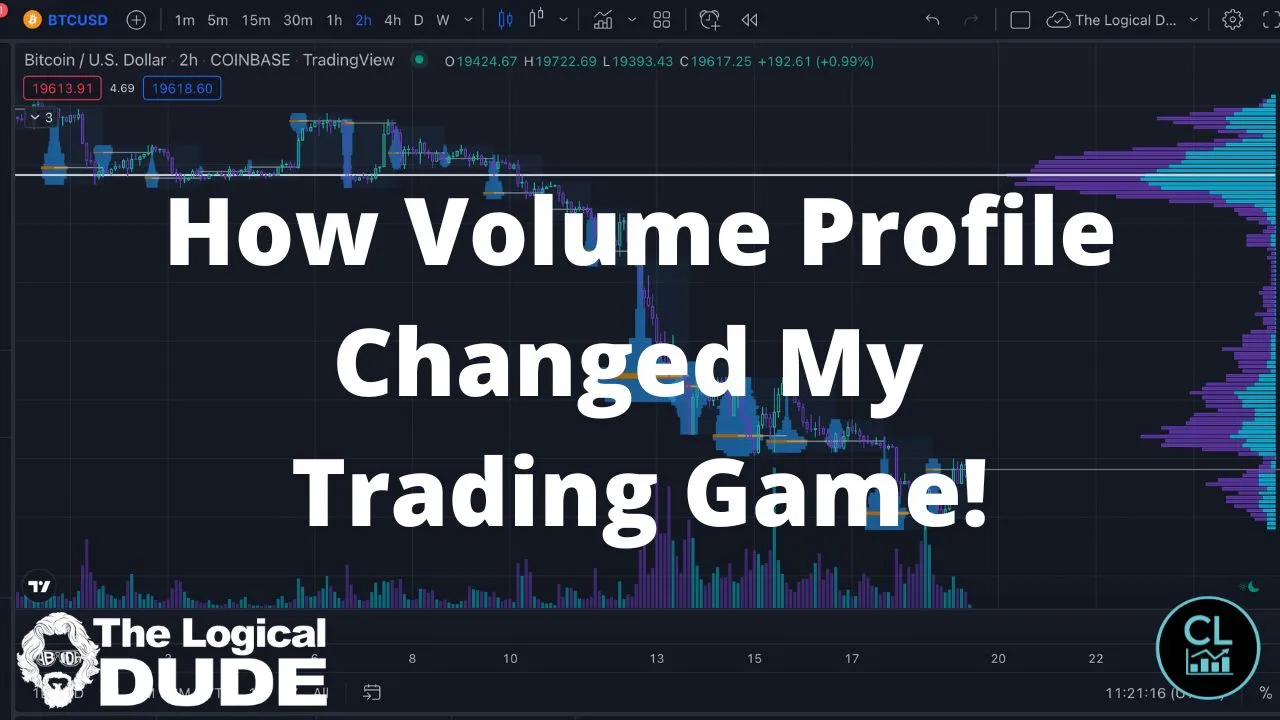
Volume Profile
The main thing he told me is that volume is EVERYTHING! He said trading with just momentum indicators and price patterns is not going to get you anywhere until you see where the big boys are stacking up their buy and sell orders. You can see this with the volume profile.
Learning to use the volume profile has completely changed my trading game. This one simple tool can tell you so much about the markets and when used properly will basically tell you where the price will be heading based on where the market is wanting to price the fair value of the asset, meaning the price they are willing to pay for it. These levels are seen by big volume nodes in the profile. This indicates that there is allot of money piling in at at certain price level.
The one reason many smaller retail traders do not use volume profile, is that if you are using TradingView, you have to pay the subscription to use their official tools. Well there are some great community made volume profile indicators out there. I have found 2 that I love. I have done a bit of my own setting customization to them, but they are the best two free plugins I have found to use in combination with the standard volume indicator.
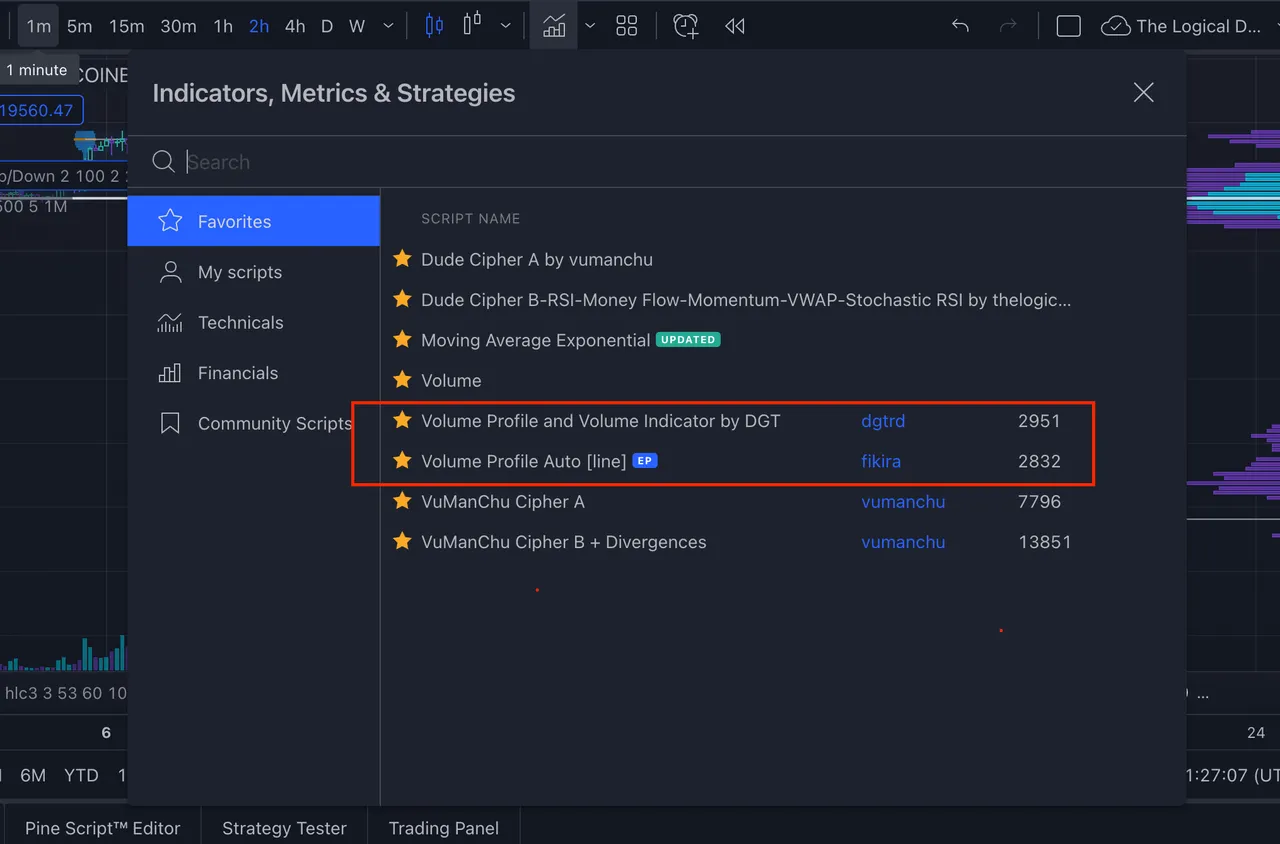
The Volume Profile and Volume Indicator by DGT is great for pulling the profile of the past 360 candles of time, this works on any time frame, for any asset.
The Volume Profile Auto [line] indicator is for more short term sections so that you can see the more micro levels. When working in combination with the other indicator, you get a great view of how the markets are being built.
Standard Volume Vs Volume Profile
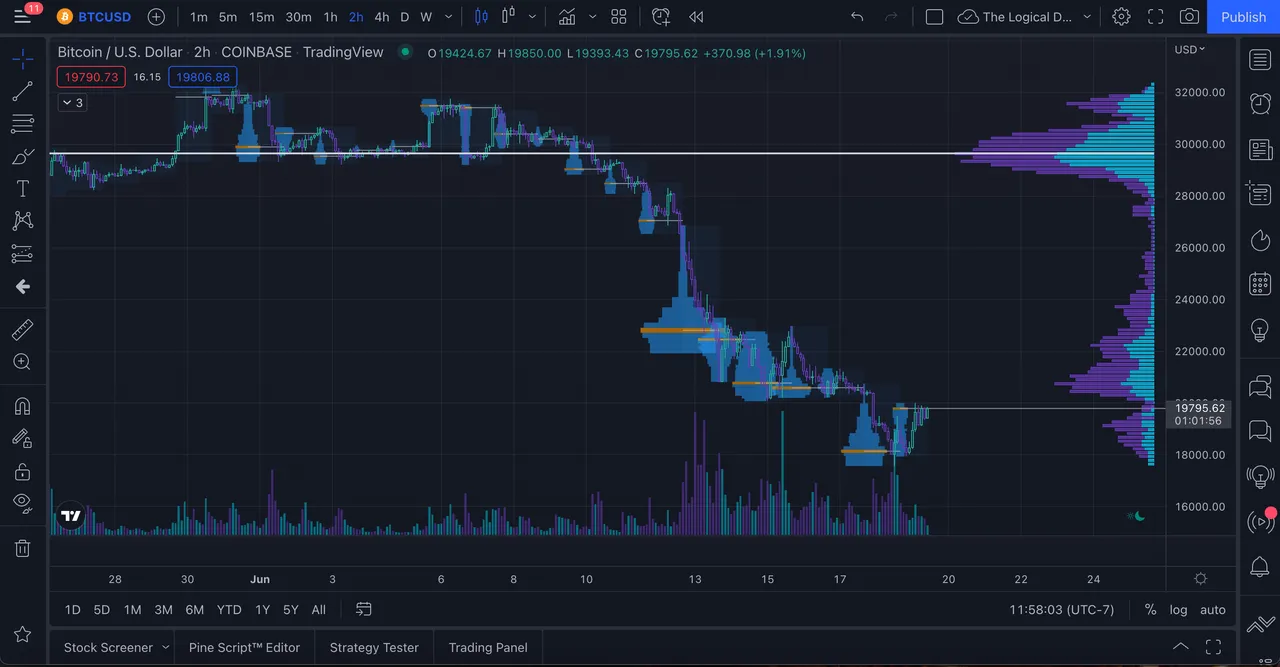
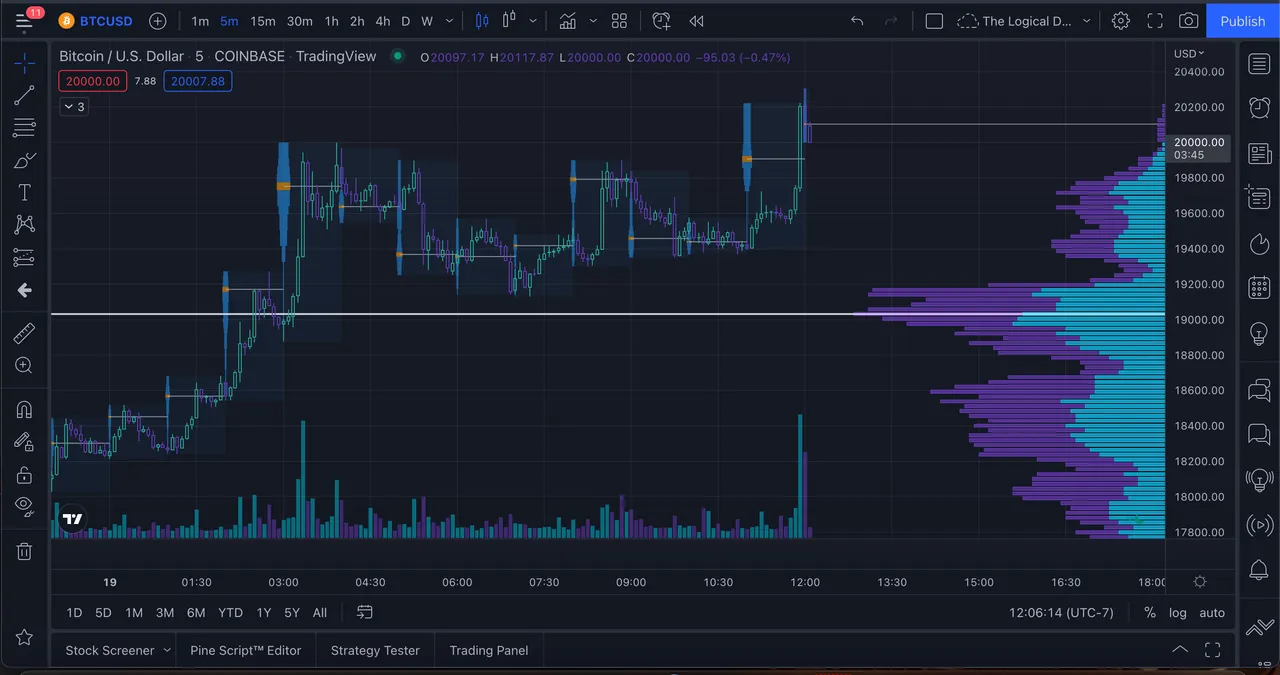
In this chart I have all 3 volume indicators turned on. I have the standard time based volume at the bottom. This shows the volume for that candle. The volume profile on the right is volume based on price and time. You can see when and at what price levesl the big money has been piling into the markets. You can also see that it corresponds with major support and resistance levels.
Point of Control
The white line in the chart shows the point of control for that time frame in the last 360 candles, in this case every candle is 2 hours. The point of control is the level where the highest amount of volume has happened. This means allot of buying and selling happening at these levels. This is what creates support and resistance levels.
The idea is that the price may get away from that point of control, but should move back to that level at some point. Although it is not always the case, but when it does, oh man is that the place to make a trade.
For example, you see here that when price broke the point of control, it was a free fall. But the further away it got, the slower the momentum went. This was the recent Bitcoin crash, which I was able to catch the break of the level and get into a major short that really helped the portfolio as well as my confidence in the strategy.
Smaller Time Frame Volume Profile
Having the volume profile on the micro sections of the charts also helps paint the picture of how the market is building structure on those levels and if you pay attention to the point of control on those levels, it helps show you a more rounded outlook of what the price is supposed to be.
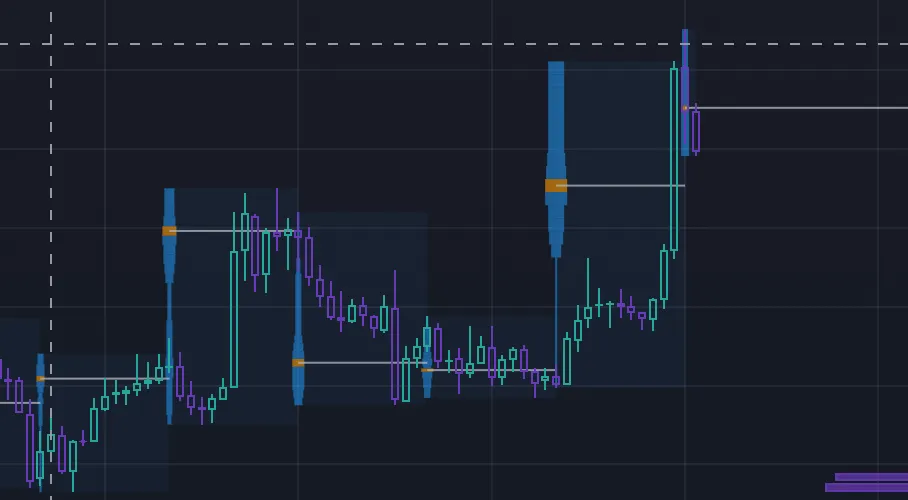
You can see these little mini points of control get respected or rejected in a serious way. They are a great guide on being able to run with the big boys.
As I have been playing these shorts, the combination of these tools has been all I have needed and I have been able to pull out some big gains from these trades. The price reacts to the previous sections points of control as perfect support and resistance levels.
The Strategy Is Simple
Long support, short resistance! That's really the game. You can play any time frame you want and the game is still the same. But with these tools, you really get a great idea of what is about to happen.
If the price breaks support, it's time to look for a move, up or down. if it breaks to the downside, it can be wise to wait for a pull back to test the previous level as resistance, that is the time to short. Just the opposite for the long side. If it breaks resistance then turns it into support, let it confirm the bounce and then go long.
Knowing where the big boys are wanting the price to go is like having a cheat sheet for a school test. You already know where they are liking the price of the asset, so just ride the waves, because I guarantee you, you don't have the money to try and counter trade them, lol.
Not Financial Advise
So this is not financial advice, this is just the new strategy that I am using. I am also still using this in conjunction with the market cipher indicator which is the ultimate momentum indicator. It has the RSI, Stoch RSI, Money Flow Indicator, VWAP, and a momentum indicator which essentially is the MACD.
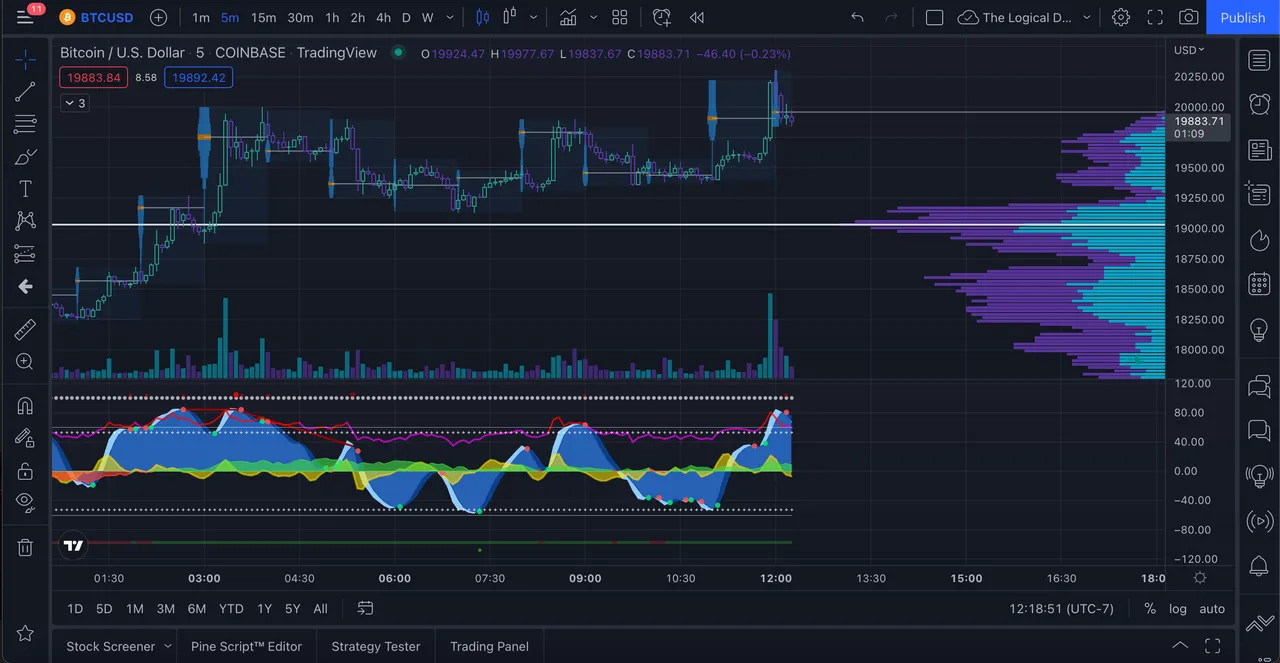
Using market cipher as a guide to let you know if the momentum is hot or not, in combination with the volume profiles will make for some beautiful trade setups. Basically letting you score on any time frame. This means that with the 24/7/365 crypto markets, you can make money any time of day!
I highly suggest watching as many videos on using the volume profile as you can. It will open your eyes to what you have been missing out on!
Next post will be about the other tool my new trader friend told me to learn, which also played a huge role in my recent trade wins, the Order Flow charts! So make sure you follow either this account or @coinlogiconline to keep up to date!
Come and also check out my crypto market and news research site, https://coin-logic.com, and get the latest market data, trending coins, charts, and more!
Be Cool, Be Real, and always Abide!
Support The Logical DAO
If you want to support the efforts of The Logical Dude and his projects that come out of The Logical Labs, you can support by purchasing a special NFT directly from the site using pHBD on Polygon! These funds are used to fuel the income engine in The Logical DAO
https://thelogicaldude.com/nfts
https://thelogicaldude.com/dao
The Logical Labs Projects
https://hivelist.io - Classifieds, NFTs, DEFI Pool, Online Retail
https://HiveHustlers.com - Community for Entrepreneurs and All Around Hustlers
https://coin-logic.com - Live crypto market data, news, and research
https://blocktunes.net - Music NFTs, DAO, Downloads, and more
https://groovelogic.audio - DJ/Producer/Sound Engineer music and services
https://weedcash.org - The Highest Form of Social Media
Video Channels
View my channel on 3speak.tv! Video platfrom for a free speech society!
https://3speak.tv/user/thelogicaldude
You can also come follow the Coin Logic TV YouTube channel if you still are wanting to support that platform:
https://youtube.com/coinlogictv
Other Ways To Support
If you like what I am doing, please consider voting for my Hive Engine witness with your staked WORKERBEE!
https://tribaldex.com/witnesses
Get started playing Splinterlands, the top blockchain game in the world, today!
https://splinterlands.com?ref=thelogicaldude