[EN] Hello everyone. We continue to follow Bitcoin. Is everything going very well? Going fine but not great. There's a little more time for things to be awesome. This time will be when the averages, not the normal prices, break the resistances.
Graphics are now preparing for this time when we say 'it will be amazing'. If things go well, I think the real run will start after 1-2 weeks, maybe a little less. Although things are not going well, I do not expect very deep falls. Still, you need to be ready for anything.
BTCUSD BUY SIGNAL IN THE HOURLY GRAPH

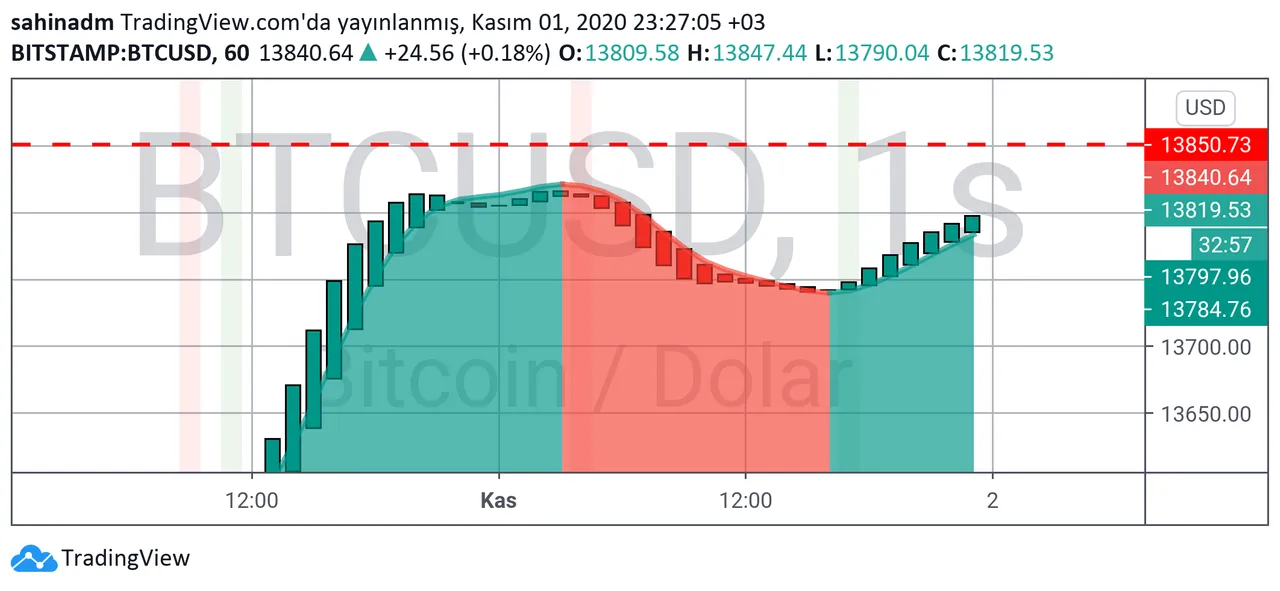
The BUY signal remains weak for the time being on the hourly chart. Prices seem to be fixed around $13830. This is a process that will change the course of the chart, because fixed-range price movements create narrowing triangle patterns and a squeeze occurs after a while. When the price scissors get tight, the time comes to decide and an explosion occurs wherever the direction is.
What will be the result if we think that the direction on the hourly chart is unstable, that the daily chart is the daily chart as I mentioned in my yesterday's post and the daily chart is slow and slow? I want an answer to this question.
Hourly supports and resistances are as follows:
Resistance: $13907, $14100
Support: $13750, $13629
BTCUSD BUY SIGNAL IN 4-HOUR GRAPH

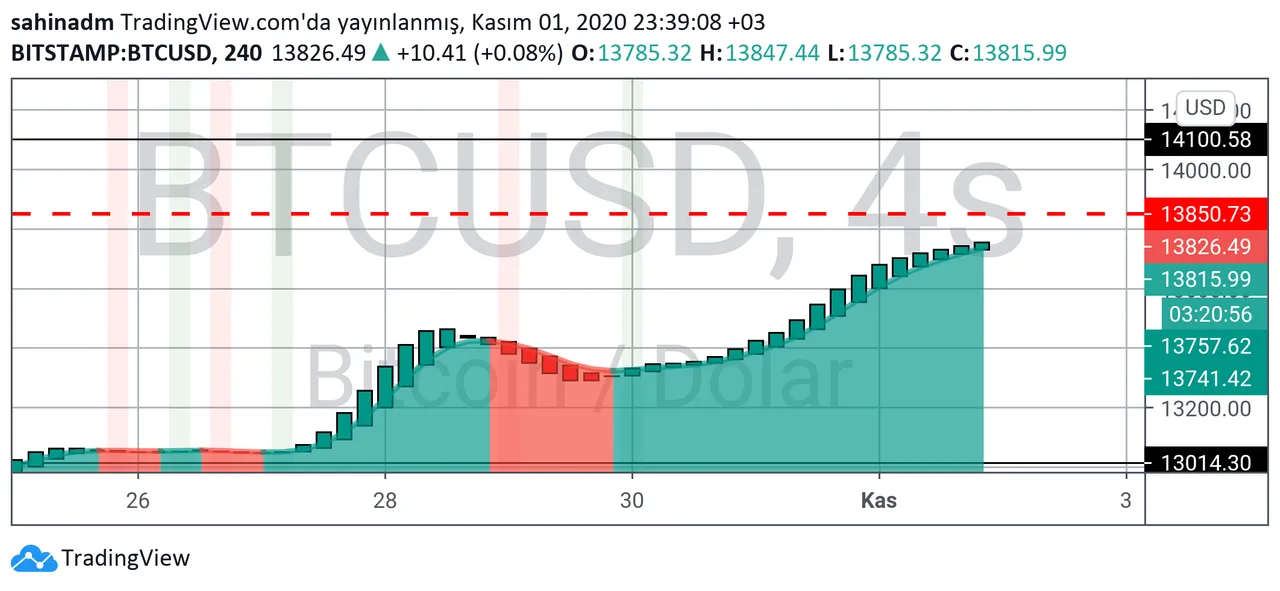
The instability of the horizontal course has also surrounded the 4-hour chart. Although it takes stronger steps compared to the hourly chart, the situations in this chart are also tight. If it continues, it can move to the SELL position. But this can only happen if they are under pressure for longer or if there are hard sales. It continues horizontally for now. We think optimistically.
There is $14100 on the 4-hour chart as resistance and $13129 as support. The scissors gap between support and resistance on the 4-hour chart is wider than on the hourly chart. This shows that the movement area is more spacious. This perspective may cause upward orientations. The situation is good.
BTCUSD BUY SIGNAL IN DAILY GRAPH

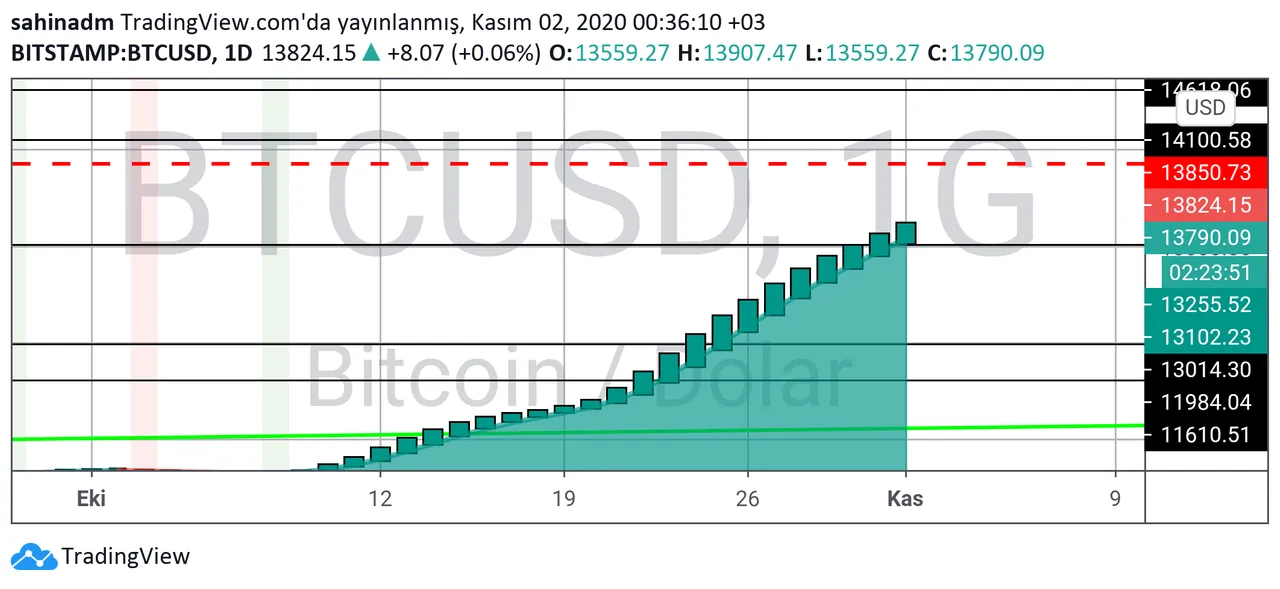
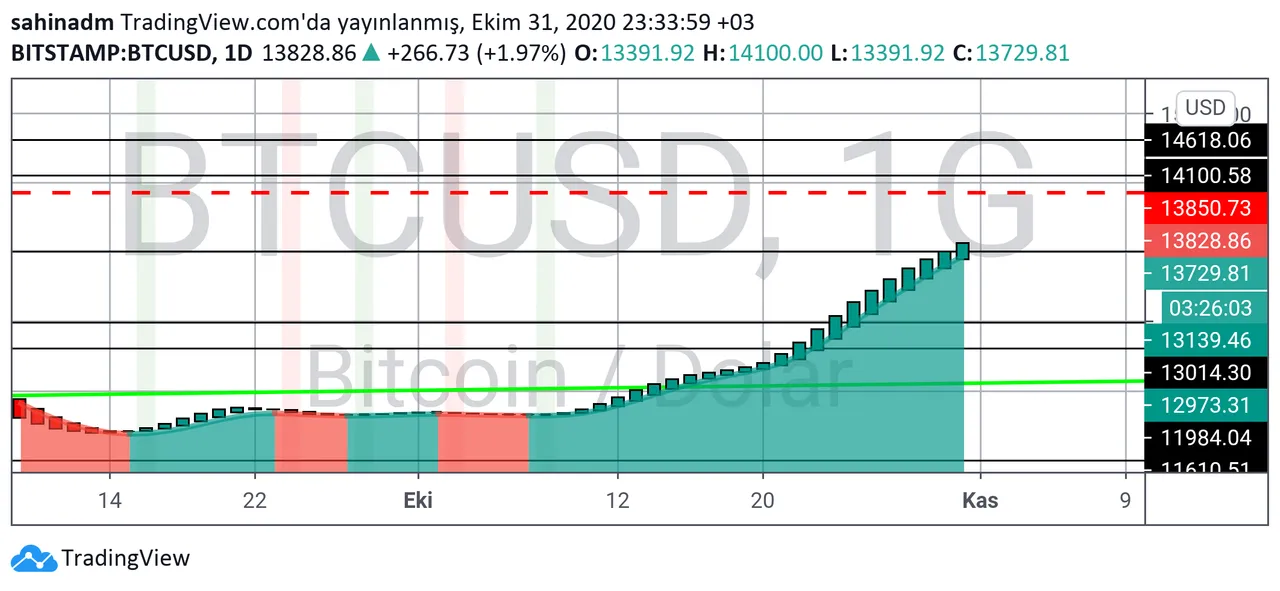
The daily chart progresses again without being affected by anything. This good progress gives hope. As long as the BUY signal continues, no problem. Unless there are very, very hard sales, there will be no sudden trend change. In short, the situation is good on the daily chart. There is no need for too much extension or dishonesty.
Resistance for the daily chart: $14100, support: $11200
I have to make a small note; If the resistors are fixed and the supports are going up day by day, the situation is good.
Good luck.
Herkese merhaba. Bitcoin'i takip etmeye devam ediyoruz. Her şey çok güzel mi gidiyor? Güzel gidiyor ama harika değil. Durumların muhteşem olması için biraz daha vakit var. Bu vakit, normal fiyatların değil ortalamaların dirençleri kırdığı vakit olacak.
Grafikler şu an bu 'muhteşem olacak' dediğimiz zaman için hazırlık yapıyor. İşler yolunda giderse sanırım 1-2 hafta sonra belki de daha kısa bir süre sonra asıl koşu başlar. İşler yolunda gitmese de çok derin düşüşler olacağını tahmin etmiyorum. Yine de her şeye hazır olmak gerek.
Neyse şimdi saatlik grafiklere bir bakalım.
***BTCUSD SAATLİK GRAFİKTE AL SİNYALİ ***

Saatlik grafikte AL sinyali şu an için zayıf devam ediyor. Fiyatlar 13830$ civarında sabitlenmiş görünüyor. Bu grafiğin seyrini değiştirecek bir süreç çünkü sabit aralıklı fiyat hareketleri daralan üçgen formasyonları oluşturuyor ve bir süre sonra sıkışma oluşuyor. Fiyat makası iyice sıkıştığında ise artık karar vakti geliyor ve yön nereye ise oraya doğru bir patlama oluşuyor.
Saatlik grafikte yönün kararsız olduğunu, asıl kararın dünkü yazımda belirttiğim gibi günlük grafiğin verdiğini ve günlük grafiğin ise ağır ve yavaş olduğunu düşünürsek sonuç ne olur? Bu soruya cevap istiyorum.
Saatlik destek ve dirençler şöyledir:
Direnç: 13907$, 14100$
Destek: 13750$, 13629$
BTCUSD 4 SAATLİK GRAFİKTE AL SİNYALİ

Yatay seyrin verdiği kararsızlık havası 4 saatlik grafiği de sarmış durumda. Saatlik grafiğe göre daha sağlam adımlar atmasına rağmen bu grafikte de durumlar sıkışık. Devam etmesi halinde SAT pozisyonuna geçebilir. Ama bu ancak daha uzun süre baskı altında kalırsa ya da sert satışlar olursa gerçekleşebilir. Şimdilik yatay devam ediyor. İyimser düşünüyoruz.
Direnç olarak 4 saatlik grafikte 14100$, destek olarak ise 13129$ seviyeleri var. 4 saatlik grafikte destek ve direnç arasındaki makas farkı, saatlik grafiğe göre daha geniş. Bu da hareket alanının daha ferah olduğunu gösteriyor. Bu bakış açısı yukarı yönlendirmelere sebep olabilir. Durum güzel.
BTCUSD GÜNLÜK GRAFİKTE AL SİNYALİ

Günlük grafik yine hiçbir şeyden etkilenmeden ilerliyor. Bu güzel ilerleyiş, umut veriyor. AL sinyali devam ettiği sürece sıkıntı yok. Çok çok sert satışlar olmadıkça da ani trend değişimi yaşanmaz. Günlük grafikte de durum iyi kısacası. Çok uzatmaya, lafı dolandırma ya gerek yok.
Günlük grafik için direnç: 14100$, destek ise: 11200$
Küçük bir not düşmem gerekiyor; dirençler sabit, destekler her geçen gün yukarı çıkıyorsa durum iyi demektir.
İyi şanslar.
Dilerseniz yazıyı buradan da görüntüleyebilirsiniz.

Analizlerim hiçbir şekilde yatırım tavsiyesi değildir, genel durumu belirlemek içindir. Bu analizler al/sat yapmaya uygun değildir. Bu analizlere dayanarak yapılan alım veya satımlardan doğacak zararlardan yatırımcı sorumludur.
Grafikler, www.tradingview.com grafik veri sunucusunda @sahinadm tarafından oluşturulmuştur.
