Indicators. Everybody is in love with indicators!
EMAs, SMAs, MACD, RSI - it seems no matter where you look on the internet indicators are the way to go when it comes to making smart trading decisions.
Popular crypto youtubers go on and on about technical indicators as if they were a law of nature, forecasting price behavior, gauging where the market will go next and advising newcomers how to best capture profits in the current market by using these tools.
Apart from one or two lone sources out there, I really see the usefulness of indicators questioned nowhere - presumably because they are so reliable and profitable, right?
Well, whenever a vast majority of people are of the same opinion that can be so readily found and adopted by even the newest newcomer, when a certain viewpoint is outright advertised, dogmatically represented and taken as an established "given" without any second thought - we should be wary and take a closer look!
Question is: How good are indicators actually? Do they deserve to be treated as the "no-brainer" basis for making good trading decisions or... is everybody just drinking the cool-aid?
It's not my intention to convince anyone, rather I want to add some data to the discussion that seems not only relevant but potentially paradigm-shifting.
As it's been so eloquently put: "The truth will piss you off before it sets you free" ;)
Gauging the usefulness of technical indicators
How can we find out if technical indicators are of help to us as traders? Well, as with anything in our field of study, we can look at data. Data that is curiously unknown in the crypto trading community I might add...
You see there has been a vast backtesting effort of indicators published by Finviz (Financial Visualizations) in which they went back and analyzed historical data from the stock market totalling roundabout 17.000 stocks over a 14 year period from 1995 to 2009, testing the reliability and profitability of signals generated by the most frequently used indicators out there.
This is based on a vast amount of trades and certain static criteria:
- Stock price has to be at least $1 to exclude low liquidity/high volatility penny stocks
- Daily trading volume has to be at least $100,000
- Automatic closing of trades 5,10 and 20 days after the entry signal has been generated, executed on various respective indicator settings
- Fees and commissions have been excluded from the results
The study notes that buy signals have been more successful during this period overall because of the "strong uptrend" present.
To gauge the usefulness of the indicators tested, the results are compared to pure random trading which would give a trader the chance of winning as flipping a coin would - 50:50.
To make the results more graspable the team has added a "T-Test" column that compares the dependency of the indicator's results with the random value. Negative T-values signify results worse than random trading would provide whereas positive t-values show a win rate better than trading randomly.
The data
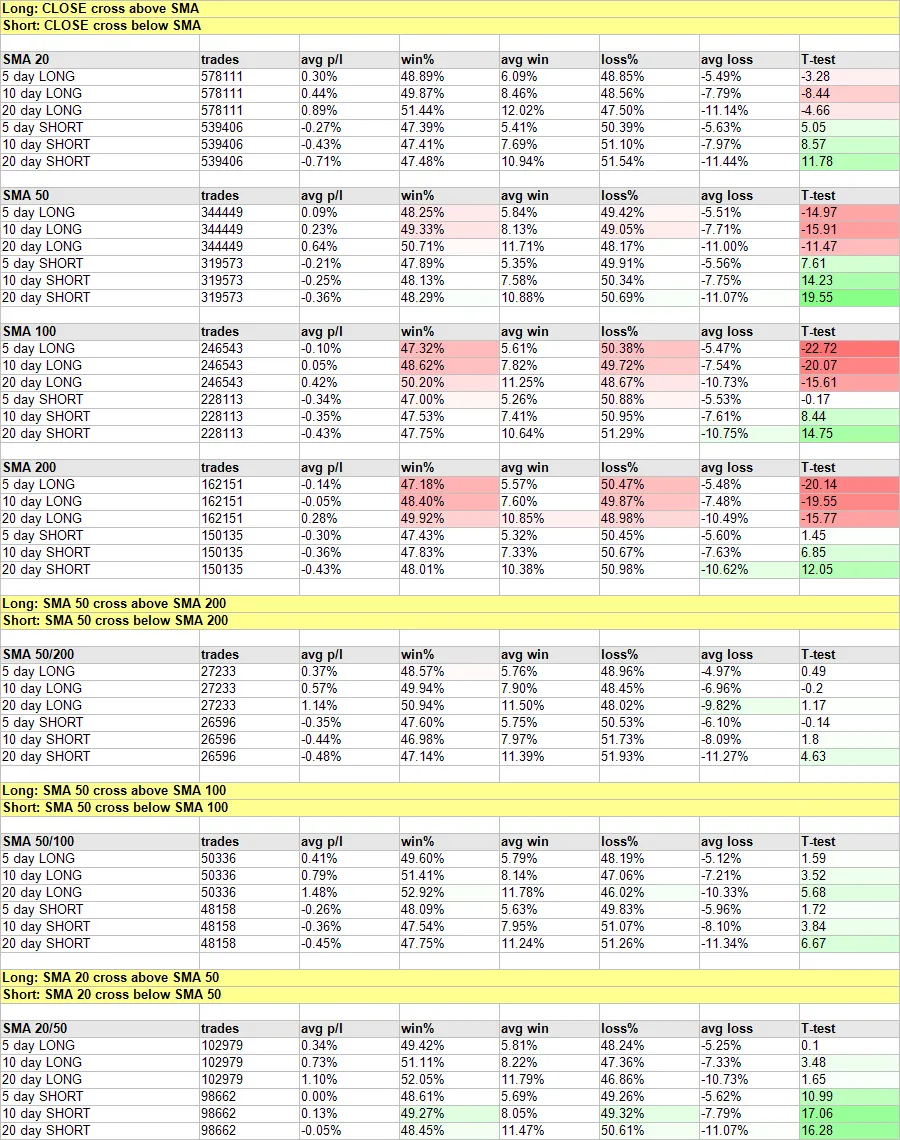
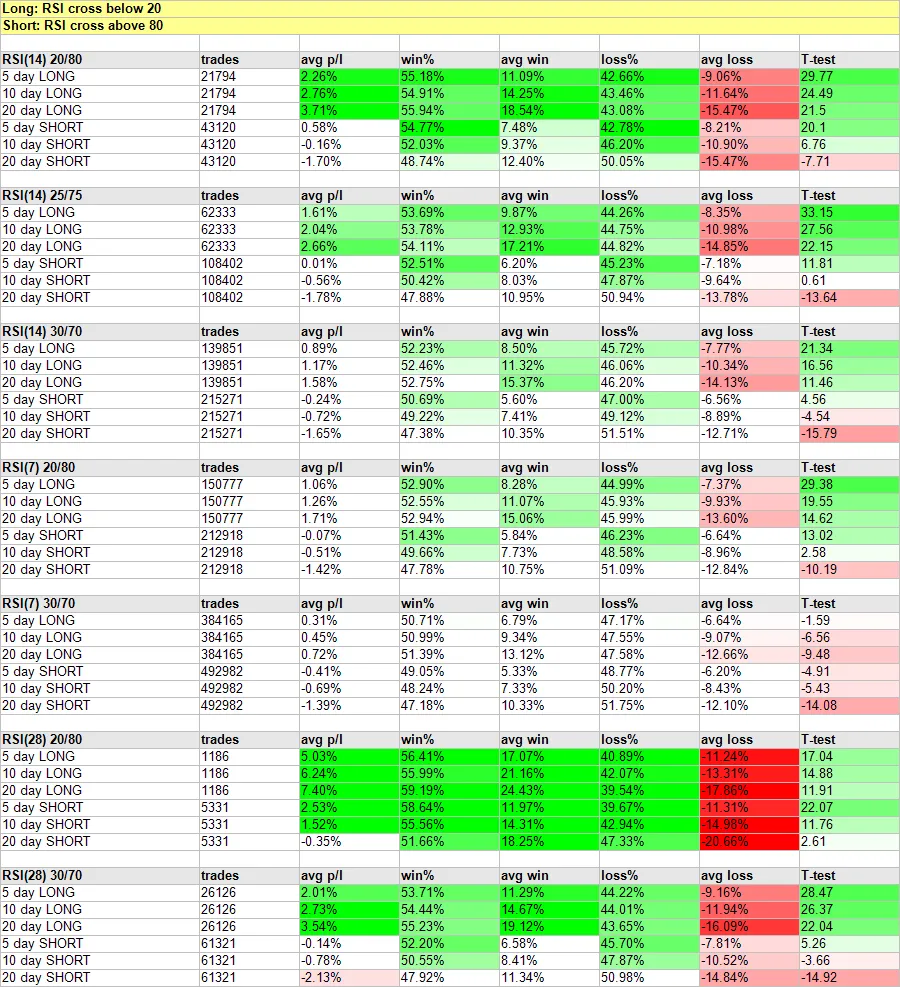
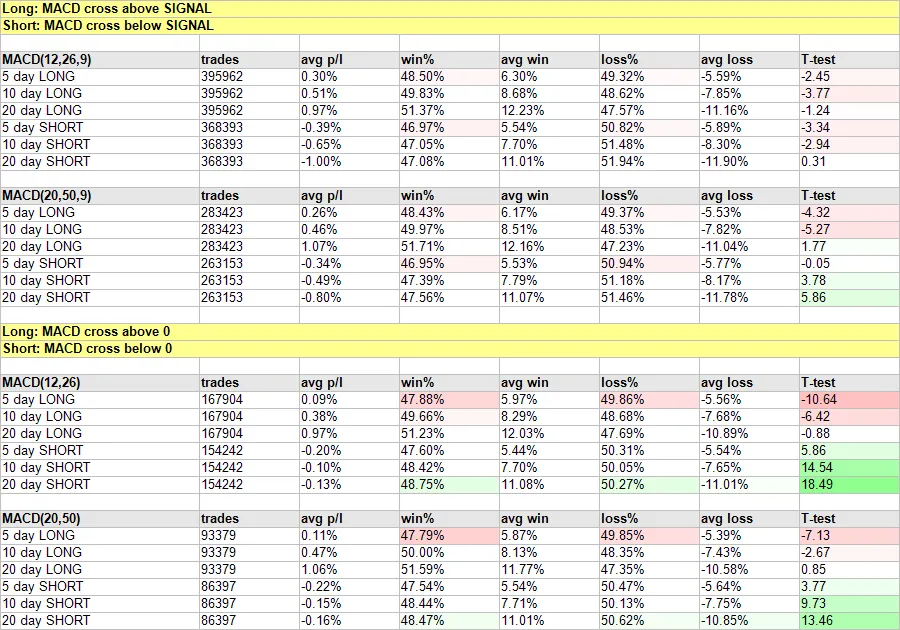
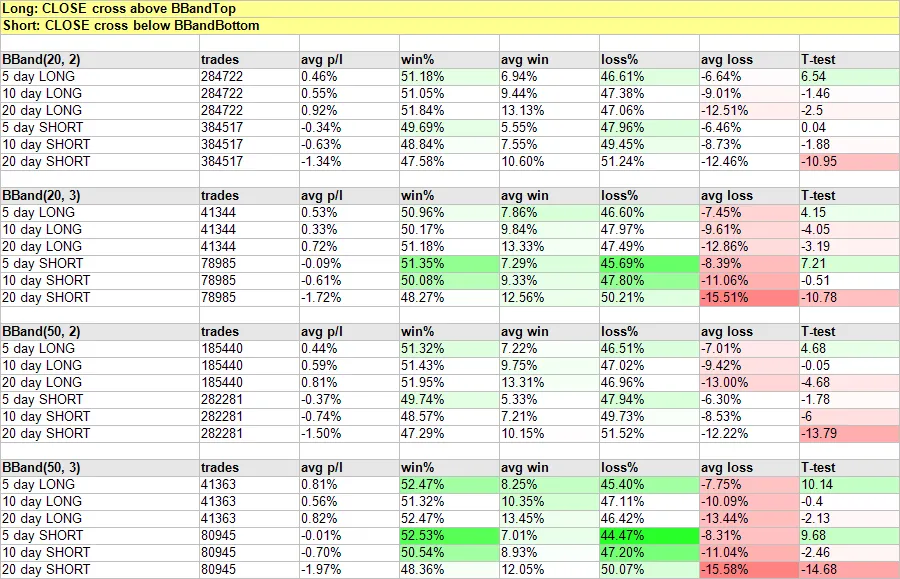
Here are some excerpts from the study, relating to the most popular indicators out there:
The results
To most traders the results will be quite... surprising. Let me paraphrase Finviz' conclusions here for ya:
- SMA:
In most cases we get results worse than trading randomly sometimes close to the benchmark but never better. This implies that the indicator is "useless".
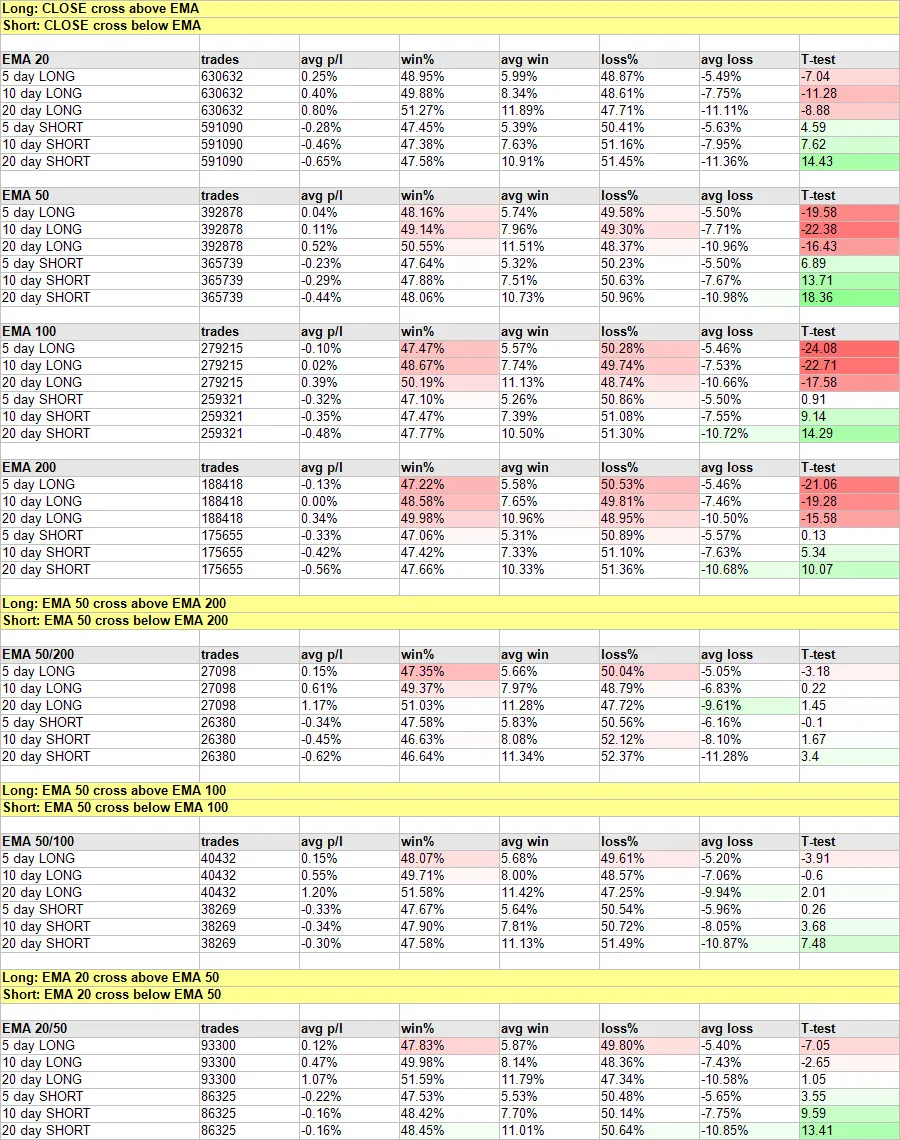
- EMA:
Better results for 10 and 20 day sell signals than trading randomly, albeit still generating considerable losses. This implies that the EMA is "not suitable for trading".
- MACD:
Very low successfulness.
- RSI:
The clear winner of all indicators tested. Ideal settings in the test have been 14, 20/80. Issues with short positions held longer than 5 days, presumably due to bullish market environment.
- Bollinger Bands:
Better than benchmark for 5 day buy and hold (with settings 50,3). Other cases are "generally comparable to random trading".
Conclusion
You should really draw your own ;) As you might have guessed I have long given up on indicators after having little success with them and then finding this study years ago that showed me why they haven't served my trading well.
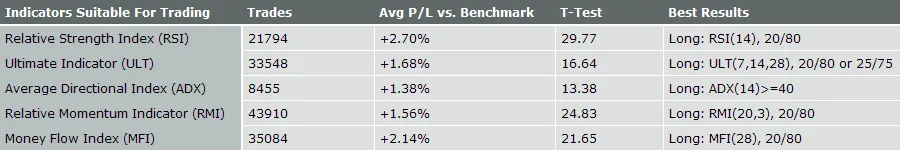
Now to be fair, let me include the indicators that performed best in the test here:
I also want to say that I do glance at RSI once in a while to spot divergences on higher timeframes, and I find the volume indicator highly useful, which is the only one I have constantly enabled on my charts.
But that is it, for me anyway... the rest of the indicators have proven to be nothing but noise.
They don't help me learn, rather it's like having a navigation system activated in your car - it will tell you where to go but you can hardly remember the way you came afterwards. And a navigation system at least does lead to the destination whereas these indicators simply do not.
They are lagging indicators and cannot be used to make reliable predictions that give you an edge.
Now you might ask yourself: What does it all mean? Do I have to give up on becoming a successful trader? What can I do if all this stuff is basically a waste of time and money?
The answer is: You will have to find your own way!
As with anything in life you can and will find out how this works, what works best for you and how to navigate it all if you have the persistency and determination to do so. We are human beings, we can learn anything. Why would trading be any different?!
Maybe it's time we stopped treating these indicators as indispensable trading tools and instead dare to have the audacity to rewrite the rules of trading for ourselves.
I feel one of the biggest pitfalls is that we have basically stopped looking. We can agree that trading is probably one of the most complex and difficult things we will ever try to learn, but seeing that the vast majority out there blindly follow and rely on strategies that show very poor results when put to the test should give you a hint that noone really knows anything out there and that there is no substitute for you to decode the markets in your own way.
If you want permission: I give it to you now.
You have permission to try to master something so many claim can't be mastered. I believe it can be mastered and that those who persist will master it eventually.
Stop following other people's advice and be bold to discover things for yourself. Use what works for you regardless of what it is or how crazy it may seem to the herd out there.
Use indicators you have had great success with despite what any study says: yes! Learn from others: yes! Try what everyone recommends you not try? Yes! Blindly follow someone else's recommendations about trading? Nope.
Mix it all in ways that work for you and be patient with yourself. Find like-minded "lunatics" out there who also dare to find their own way.
The answers will come and so will the rewards!
unsplash.com
elite.finviz.com
unsplash.com