Hello investors 📊, traders📐 and HODLERS🔗,
An introduction:
This past week was rich in price action (USD):
- BTC - LOW: 32288; HIGH: 41000; ENDS @ 38500.
- ETH - LOW: 1268; HIGH: 1760; ENDS @ 1578.
- XRP - LOW: 0,322; HIGH: 0,75; ENDS @ 0,43.
- ADA - LOW: 0,389; HIGH: 0,70; ENDS @ 0,63.
#Bitcoin (BTC)
Daily timeframe:
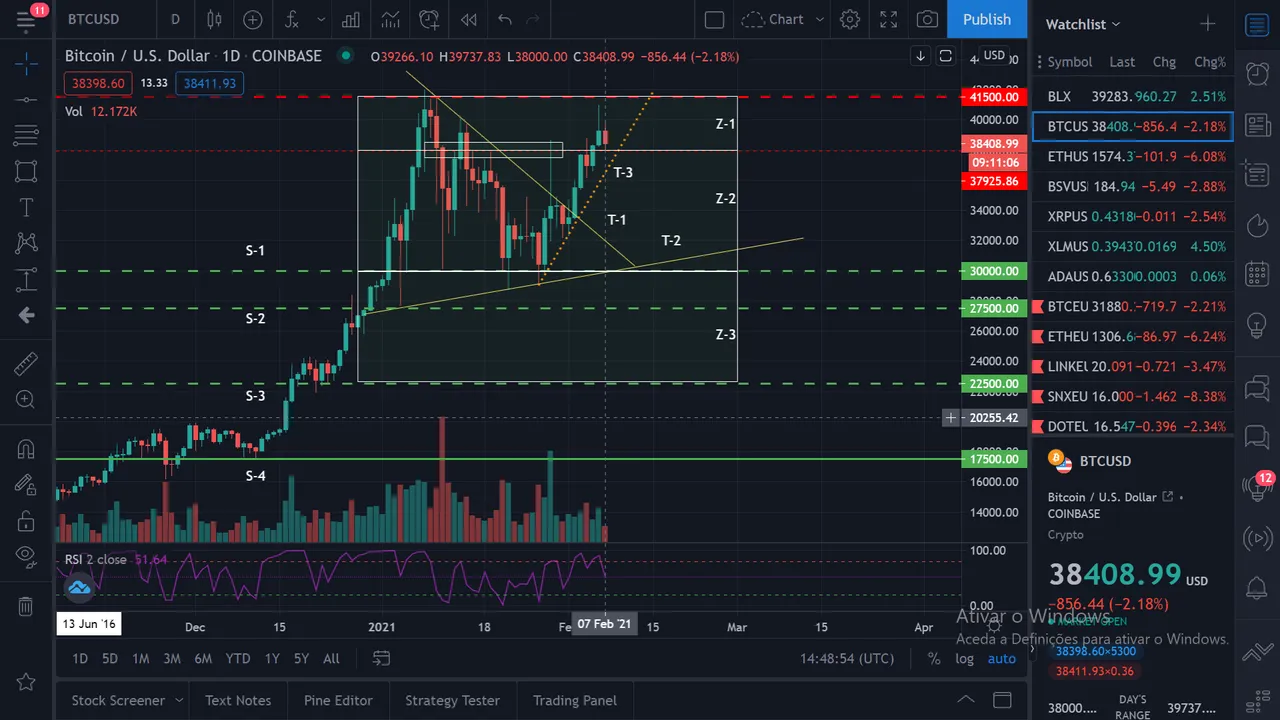
Trends:
T-1: Trend 1 - Descending from the ATH
T-2: Trend 2 - Ascending crossing with 2 suportlines
T-3: Trend 3 - Most recent, trying to reach ATH
Resistance:
R-1: 41,500 USD
Support:
S-1: Support - 30,000 USD
S-2: Support - 27,500 USD
S-3: Support - 22,500 USD
S-4: Support - 17,500 USD
Action Zones
Z-1: Zone 1 - Made and almost perfect double top. Looks to have found a temporary support on the 38,400 USD. If it dosent break the ATH a double top may be confirmed and a trend change might happen.
Z- 2: Zone 2 - comprehending the most recent support for BTC at 27,500. Might operate as the neckline for the double top.
Z-3: Zone 3 - Includes the most significant supports. Could be extended to 17,500.
The Fear & Greed Index

The big picture:
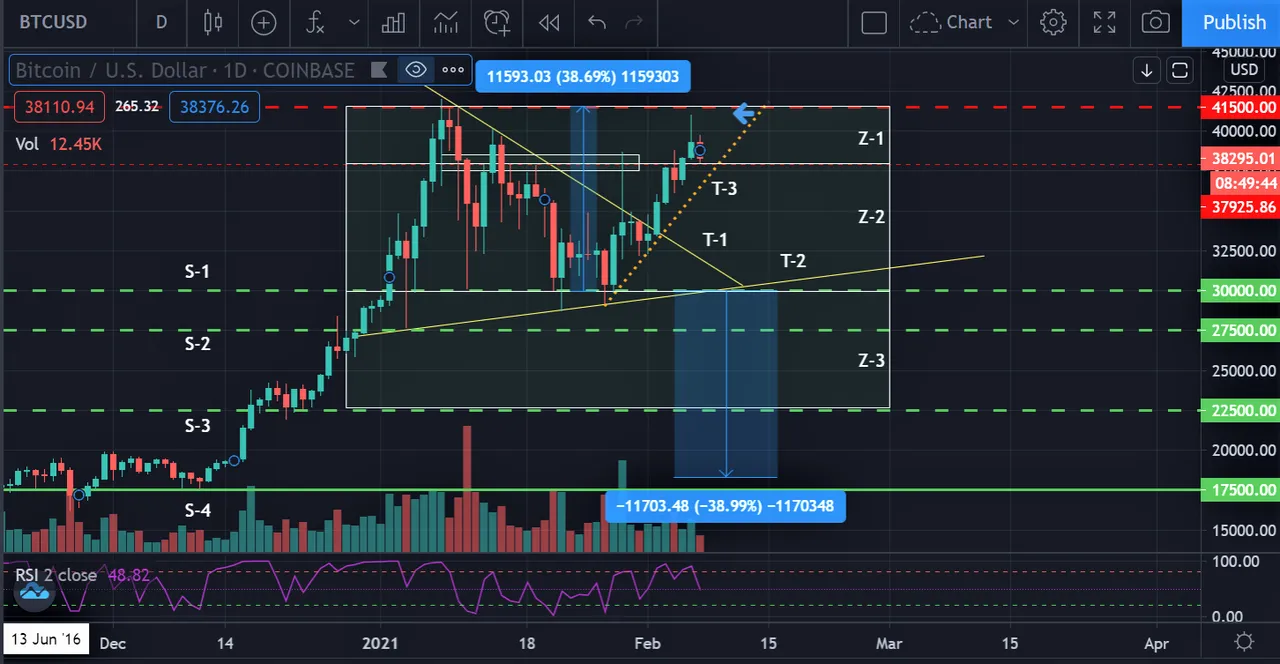
Bitcoin managed to break above the T-1 trend line which was cornering the price close to T-2. A new teporary trend line as formed (T-3) following the price to test the 41,500 ATH resistance.
A double top might be forming.
A double top usually indicates a trend reversal. It ocurs when the price fails twice to break above resistance level, leading to a corretcion on the previous trend line. The magnitude of the correction can reach the amplitude of the neckline to the resistance.
For instance, in the case of BTC the RESISTACE is 41,500 and the neckline is 3000. This could mean that the price of BTC could correct to the 17,500 USD level. This level here is one of the most significant support levels, working as a resistance back in 2018.
BTC is in a crucial moment of decision, wether it breaks above ATH or corrects to an important resistance to start another run upwards.
On the other hand BTC could just simply go upwards and find new ATH with its target on the 50,000.
Still, the sentiment on the market seems to be incresing in optimism, this could signal a redflag for some. The fear & greed index is climbing again, steady but surely.
News of the week - FOMO 📉: the case of the "double spend" Bitcoin.
This week consisted solely on price action. Maybe the most significant or "conspicuous" could be considered the XRP pump, sending XRP to as high as 0,75, and important resistance for XRP which it couldn't break, sitting rightnow at 0,39, higer than the prepump price.
For the Altcoin market, there was a significant movement in price from DOT, to SNX, to LINK, or ADA. Even XLM got up dis sunday, starting to form what seems another double top.
We consider this as FOMO, bullish news that send the market into a ramping of alts. Althoug this ultraoptimism might signal some lack of solidity and consolidation on the price.
The holle analysis was executed on #TradingView. Head up to TradingView to find the most user-friendly and complete chart analysis platform!

>> TradingView <<
If you didn't notice this article is being published on the Hive Blockchain!
It is a free, censorship resistant, social network that connects producers and consumers of content feeding social relations.
Find out more on PeakedD!
And please,if you like, live a comment and upvote if you will. That helps to improve! Thank you!
Need help? Have sugestions? Yes?!
__ Supreme! __ Reach me by commenting down below 😄.
Disclaimer :
I am NOT a certified analyst.
This are high risks, mostly unregulated, digital assets.
This is a world of
Allways have a plan B.
You should always do your own research (DYOR)!
Invest only what you can afford to loose.
Allways have a plan C.