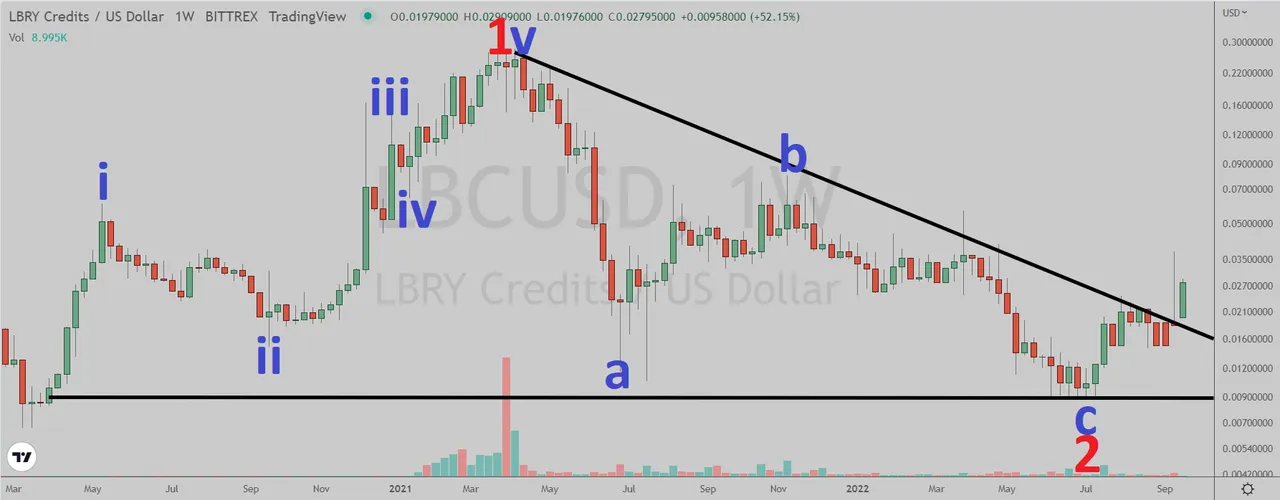
LBRY Credits (Bittrex: LBCUSD) has broken out of the triangle pattern in the weekly chart.

(Chart courtesy of Tradingview.com(log scale))
Elliott Wave Analysis
In Elliott Wave terms, LBC began a red wave one advance in March 2020. The red wave one (blue sub-waves i-ii-iii-iv-v) peaked in April 2021 and the red wave two (blue sub-waves a-b-c) correction ended in July this year. If this wave count is correct, LBC should be heading next towards the April 2021 peak in the red wave three.
(Chart courtesy of Tradingview.com(log scale))
Funnymentals
LBRY does to publishing what Bitcoin does to money. CryptoCurrent reviewed the project one week ago.
(Sources: https://lbry.com/)
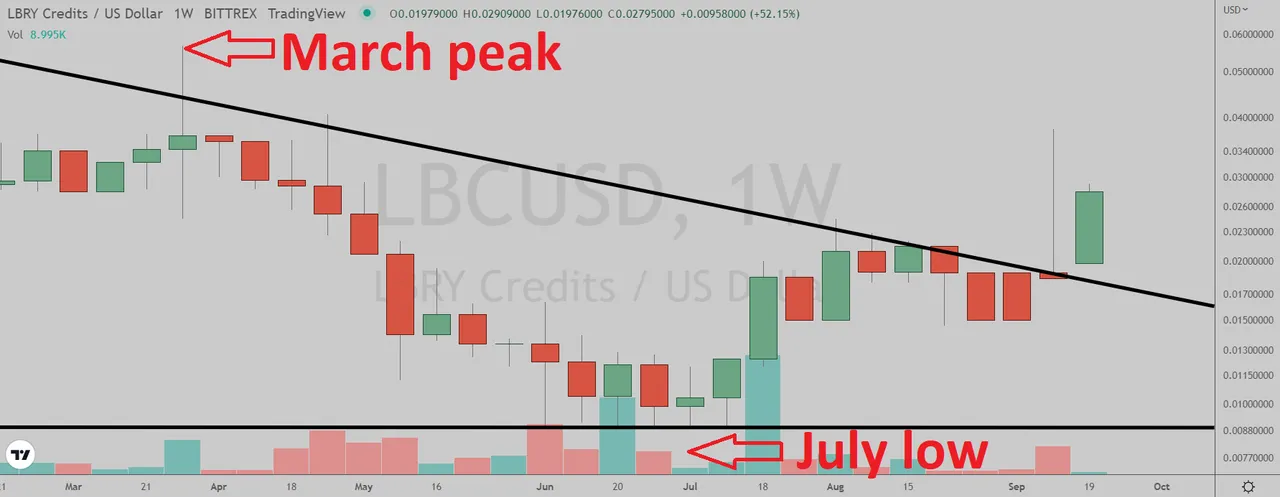
How Will LBRY Credits Trade?
LBRY Credits (Bittrex: LBCUSD) weekly chart by Tradingview.
(Chart courtesy of Tradingview.com(log scale))
Prizes
I will be giving upvotes to the correct answers (posts only).
Rules
This poll will expire in one week. Only one vote per person.
Which one will happen first?
Please select one of the three choices and comment below.
LBC will takeout the March peak
LBC will drop below the July low
LBC will stay in a trading range between the July low and the March peak until November 2