API3 (OKEx: API3USDT) has broken out of the triangle pattern in the weekly chart.
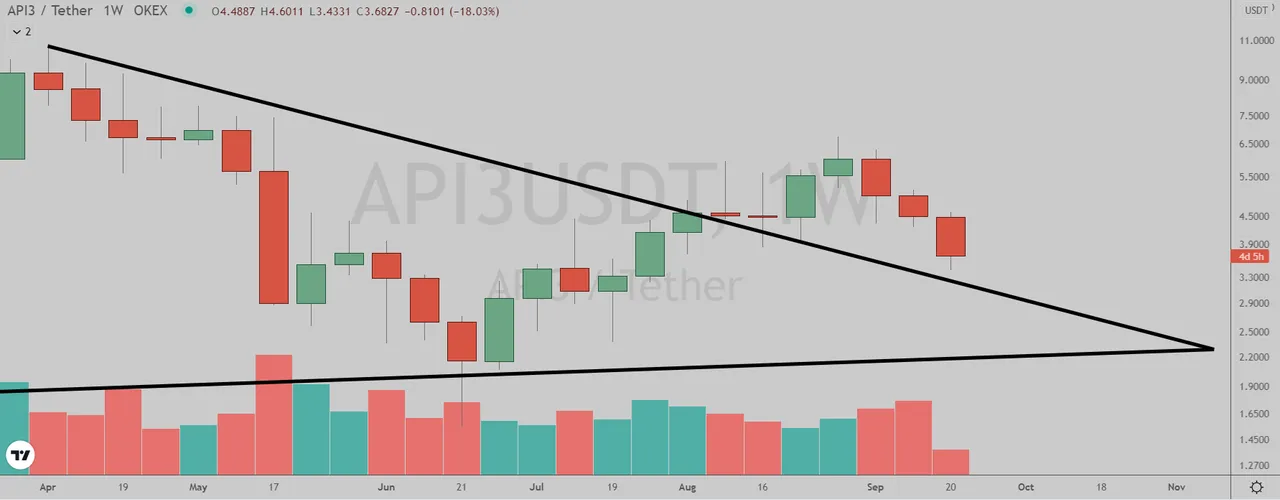 (Chart courtesy of Tradingview.com(log scale))
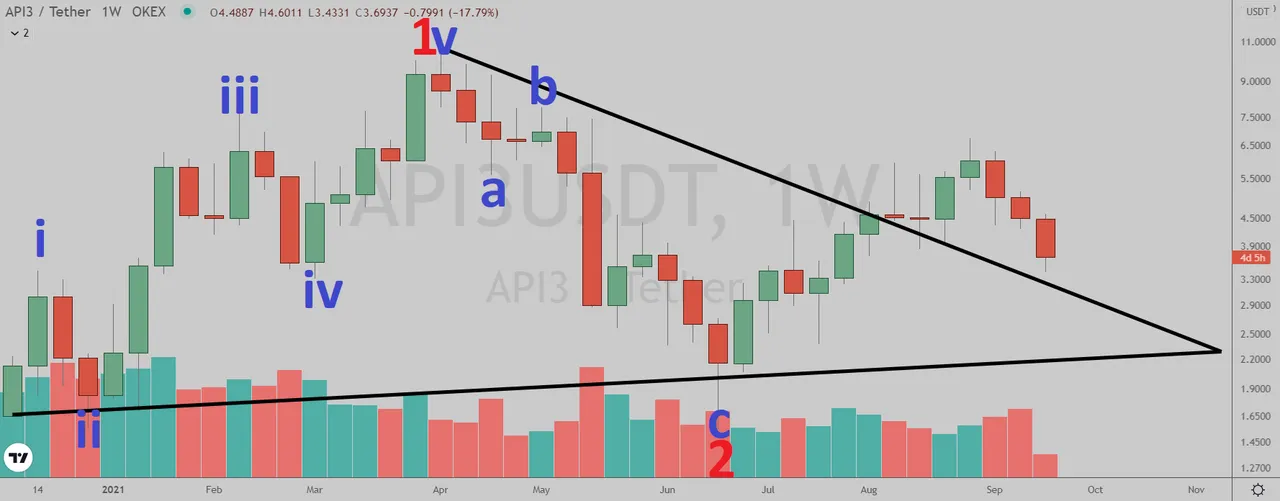
Elliott Wave Analysis
In Elliott Wave terms, API3 began a red wave one advance in December 2020. The red wave one (blue sub-waves i-ii-iii-iv-v) peaked in April this year and the red wave two (blue sub-waves a-b-c) correction ended in June. If this wave count is correct, API3 should be heading next towards the April peak in the red wave three.
 (Chart courtesy of Tradingview.com(log scale))
Funnymentals
API3’s goal is to allow decentralized versions of APIs to be built, managed and monetized at scales. Crypto Slay3r reviewed the project last month.
(Sources: https://api3.org/)
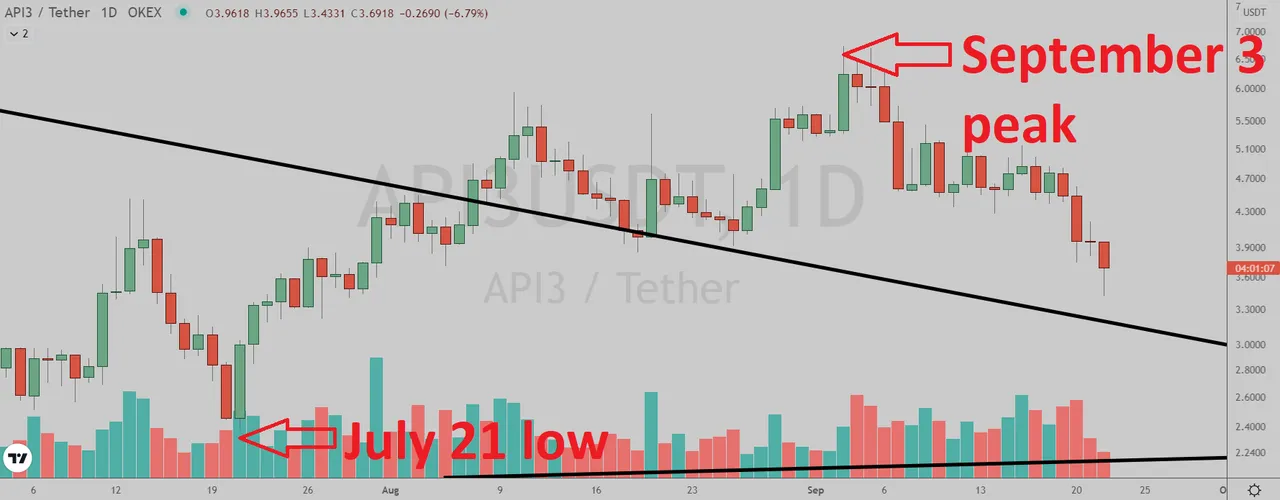
How Will API3 Trade?
API3 (OKEx: API3USDT) daily chart by Tradingview.
 (Chart courtesy of Tradingview.com(log scale))
Prizes
I will be giving upvotes to the correct answers with minimum reputation of 25.
Rules
This poll will expire in one week. Only one vote per person.
Which one will happen first?
Please select one of the three choices and comment below.
API3 will takeout the September 3 peak
API3 will drop below the July 21 low
API3 will stay in a trading range between the July 21 low and the September 3 peak until October 29