dYdX (OKEx: DYDXUSDT) has broken out of the triangle pattern in the four-hour chart.
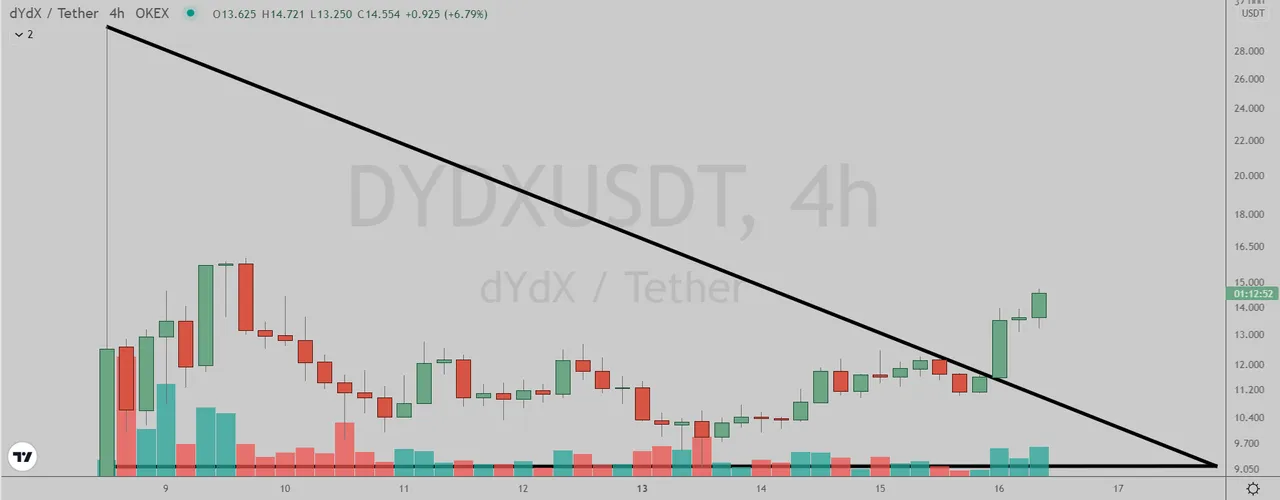 (Chart courtesy of Tradingview.com(log scale))
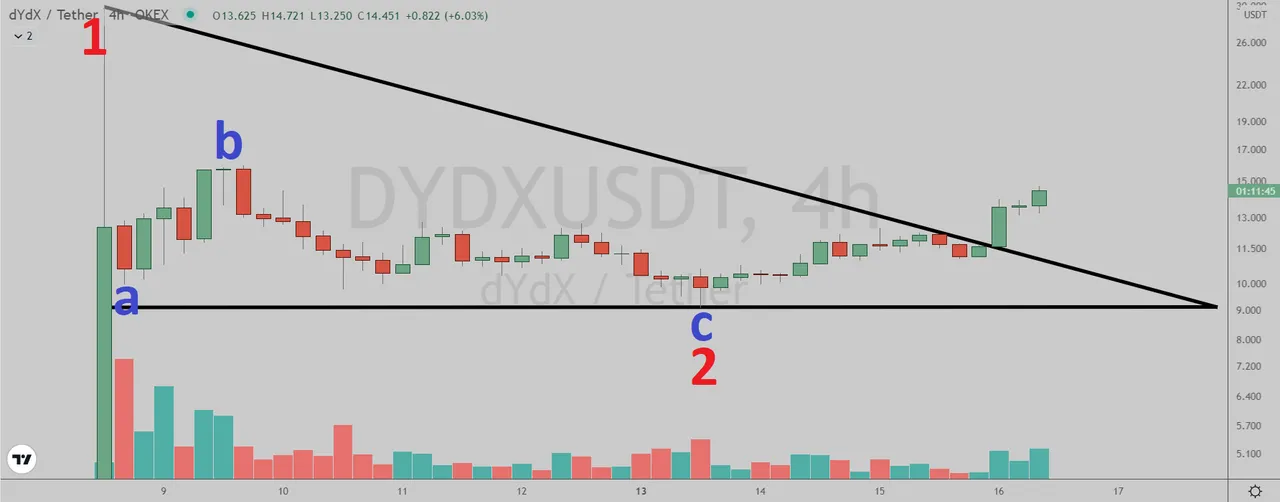
Elliott Wave Analysis
In Elliott Wave terms, DYDX began a red wave one advance on September 8. The red wave one peaked on September 8 and the red wave two (blue sub-waves a-b-c) correction ended on September 13. If this wave count is correct, DYDX should be heading next towards the September 8 peak in the red wave three.
 (Chart courtesy of Tradingview.com(log scale))
Funnymentals
dYdX offers traders with a "powerful & decentralized" infrastructure. The Brutal Investor reviewed the project last week.
(Sources: https://dydx.community/)
How Will dYdX Trade?
dYdX (OKEx: DYDXUSDT) four-hour chart by Tradingview.
 (Chart courtesy of Tradingview.com(log scale))
Prizes
I will be giving upvotes to the correct answers with minimum reputation of 25.
Rules
This poll will expire in one week. Only one vote per person.
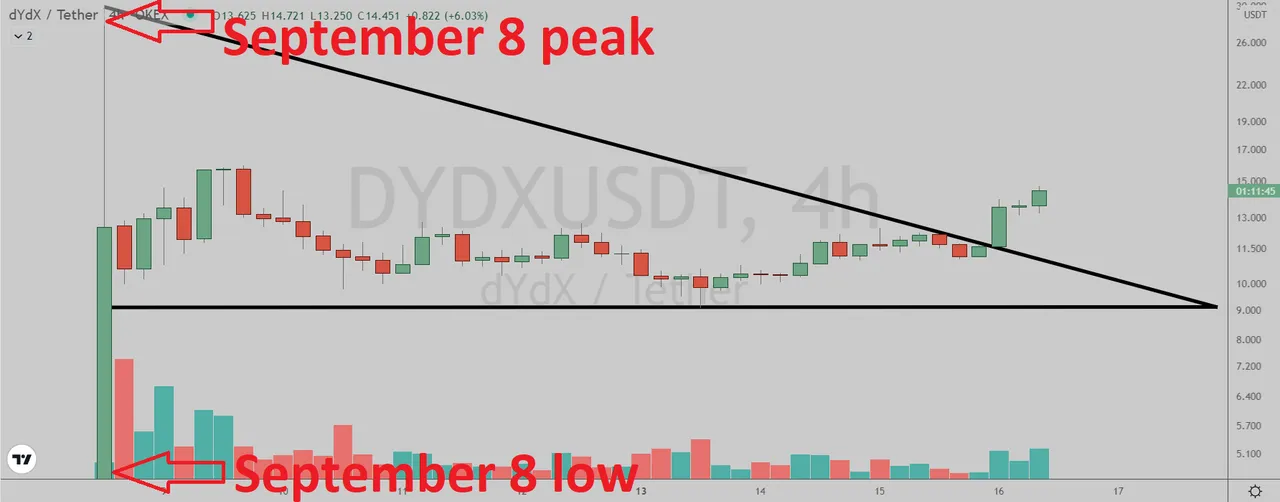
Which one will happen first?
Please select one of the three choices and comment below.
DYDX will takeout the September 8 peak
DYDX will drop below the September 8 low
DYDX will stay in a trading range between the September 8 low and the September 8 peak until October 23