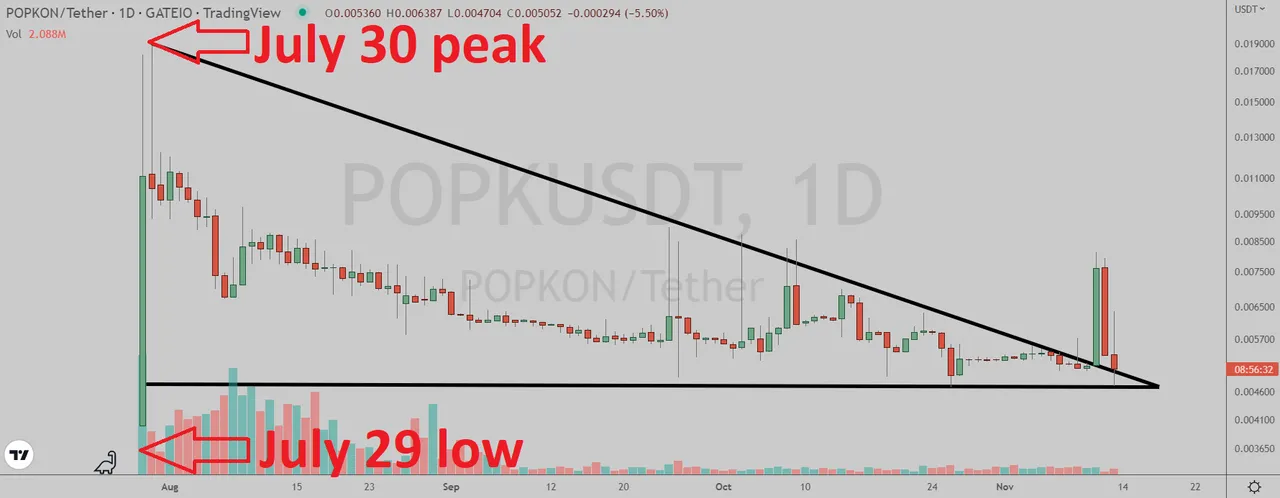
POPKON (Gate.io: POPKUSDT) has broken out of the triangle pattern in the daily chart.

(Chart courtesy of Tradingview.com(log scale))
Elliott Wave Analysis
In Elliott Wave terms, POPK began a red wave one advance on July 29. The red wave one peaked on July 30 and the red wave two (blue sub-waves a-b-c) correction ended on October 26. If this wave count is correct, POPK should be heading next towards the July 30 peak in the red wave three.

(Chart courtesy of Tradingview.com(log scale))
Funnymentals
POPK was designed to overcome the problems and limitations of the existing live-streaming platform industry, such as the closed platform economic mechanism, monopoly of big platform production, and the amount limitation of purchasing in the centralized platform. You can find their whitepaper here.

(Sources: https://www.popkon.net/)
How Will POPKON Trade?
POPKON (Gate.io: POPKUSDT) daily chart by Tradingview.
(Chart courtesy of Tradingview.com(log scale))
Prizes
I will be giving upvotes to the correct answers (posts only).
Rules
This poll will expire in one week. Only one vote per person.
Which one will happen first?
Please select one of the three choices and comment below.
POPK will takeout the July 30 peak
POPK will drop below the July 29 low
POPK will stay in a trading range between the July 29 low and the July 30 peak until December 20