XinFin Network (Bitfinex: XDCUSD) has broken out of the triangle pattern in the daily chart.
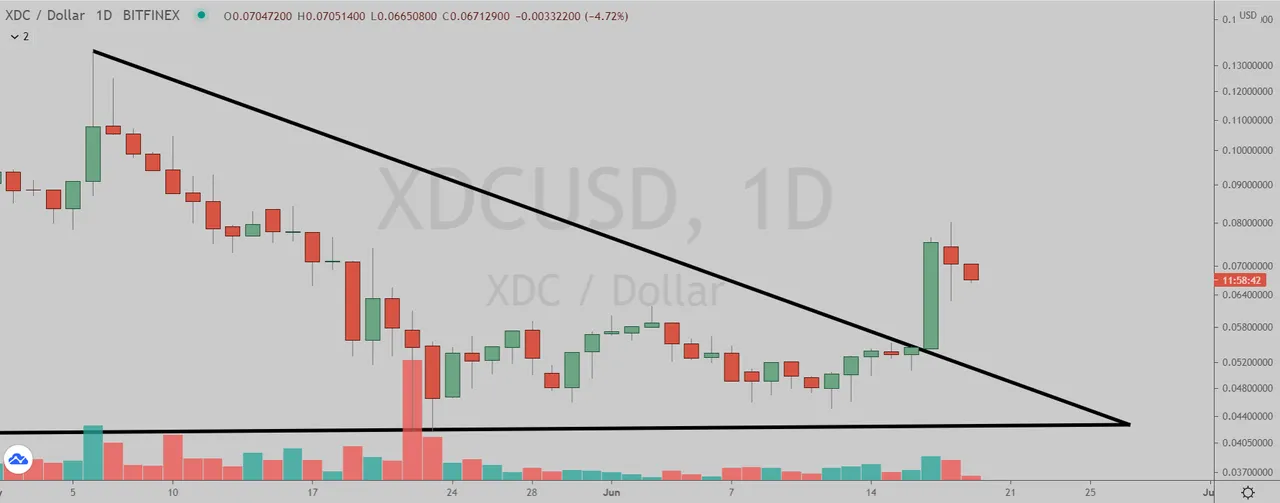
(Chart courtesy of Tradingview.com (log scale))
Elliott Wave Analysis
In Elliott Wave terms, XDC began a red wave one advance on March 13, 2020. The red wave one (blue sub-waves i-ii-iii-iv-v) peaked on August 13, 2020 and the red wave two (blue sub-waves a-b-c) correction ended on December 30, 2020. The red wave three (blue sub-waves i-ii-iii-iv-v) advance finished on April 15 this year and the red wave four (blue sub-waves a-b-c) correction ended on May 22. If this wave count is correct, XDC should be heading next towards the April 15 peak in the red wave five.
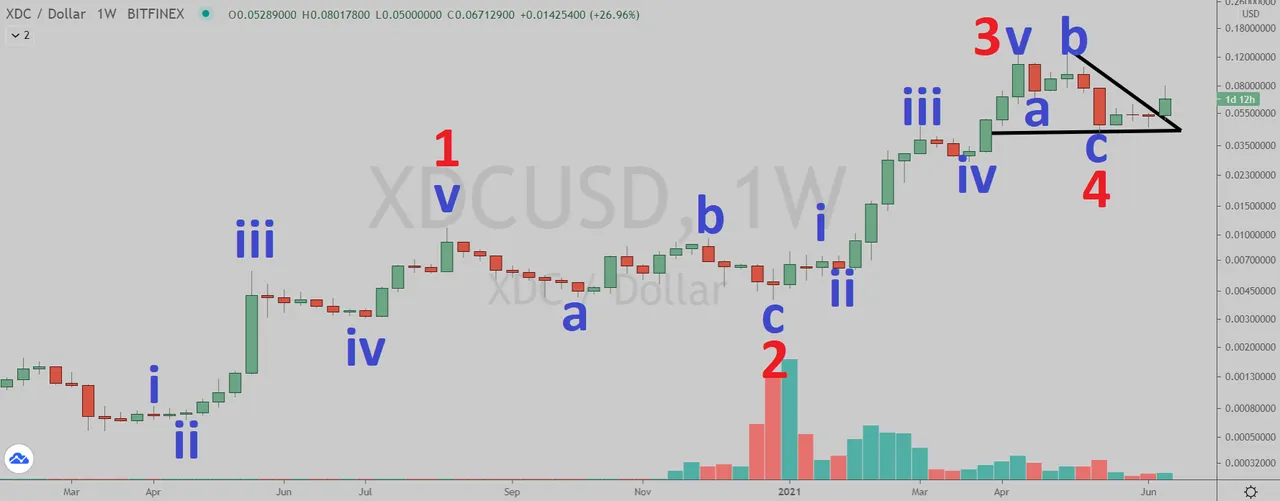
(Chart courtesy of Tradingview.com (log scale))
Zooming out in the monthly chart, I believe XDC is currently in the red wave three (blue sub-wave v). The red wave one began in June 2019 and the red wave two correction ended on March 13, 2020.
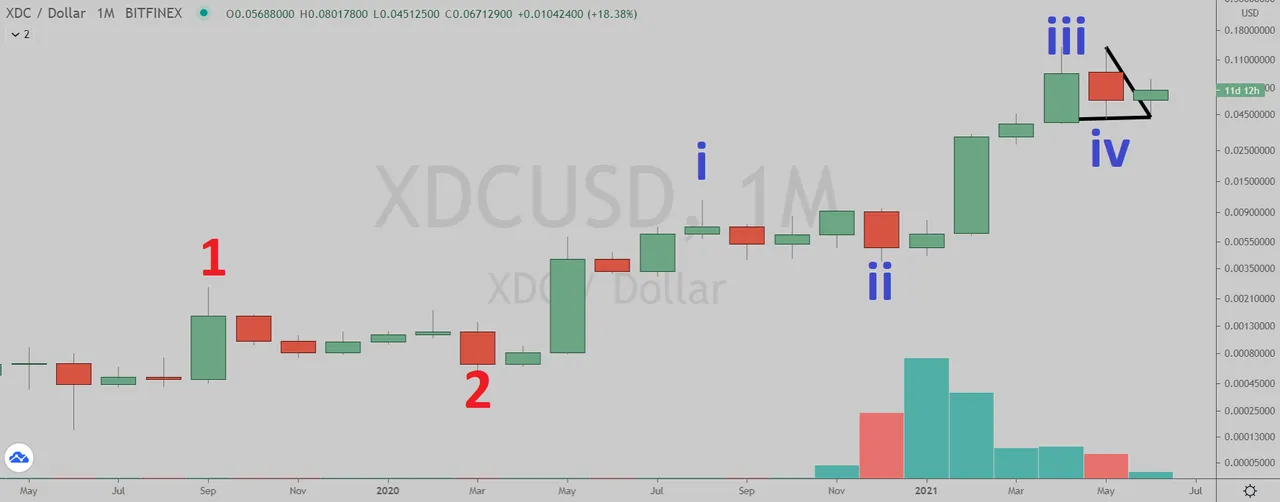
(Chart courtesy of Tradingview.com (log scale))
Funnymentals
The XinFin XDC Network is an enterprise-ready, open source, hybrid blockchain protocol specializing in tokenization for real-world decentralized finance. Token Topics reviewed the project three days ago.
(Sources: https://xinfin.org/)How Will XinFin Network Trade?
XinFin Network (Bitfinex: XDCUSD) daily chart by Tradingview.

(Chart courtesy of Tradingview.com (log scale))
Prizes
I will be giving upvotes to the correct answers with minimum reputation of 25.
Rules
This poll will expire in one week. Only one vote per person.
Which one will happen first?
Please select one of the three choices and comment below.
XDC will takeout the May 6 peak
XDC will drop below the May 22 low
XDC will stay in a trading range between the May 22 low and the May 6 peak until July 26