The Professor (Raydium: LABUSD) has broken out of the triangle pattern in the daily chart.
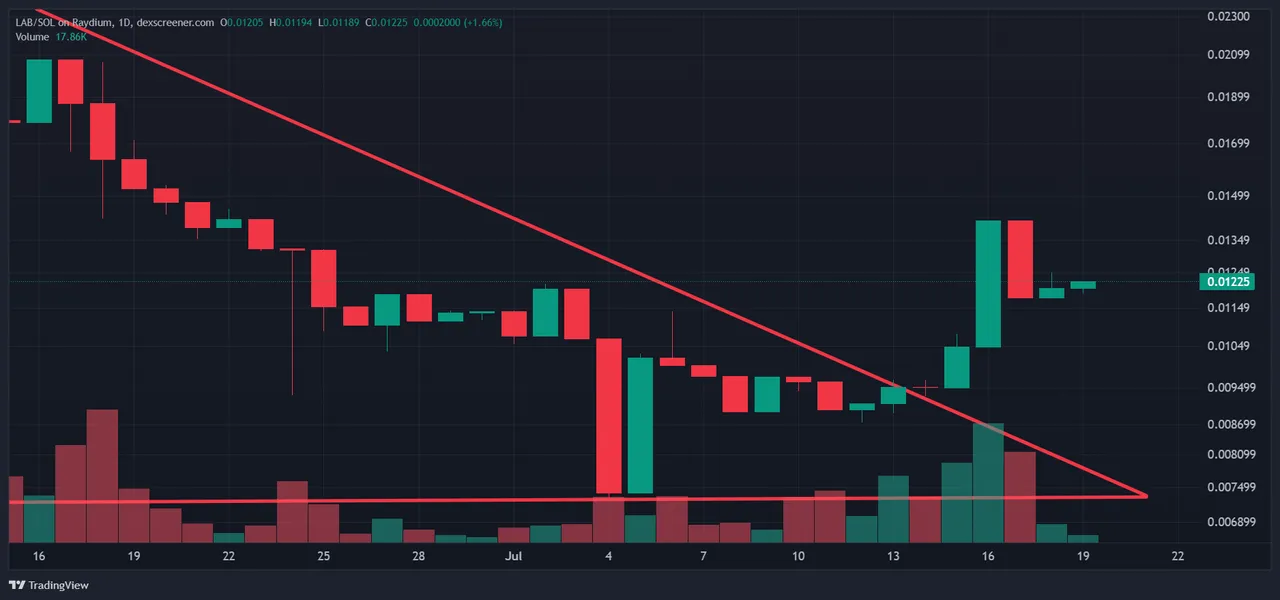
(Chart courtesy of Tradingview.com(log scale))
Elliott Wave Analysis
In Elliott Wave terms, LAB began a red wave one advance on May 29. The red wave one (blue sub-waves i-ii-iii-iv-v) peaked on June 11 and the red wave two (blue sub-waves a-b-c) correction ended on July 4. If this wave count is correct, LAB should be heading next towards the June 11 peak in the red wave three.
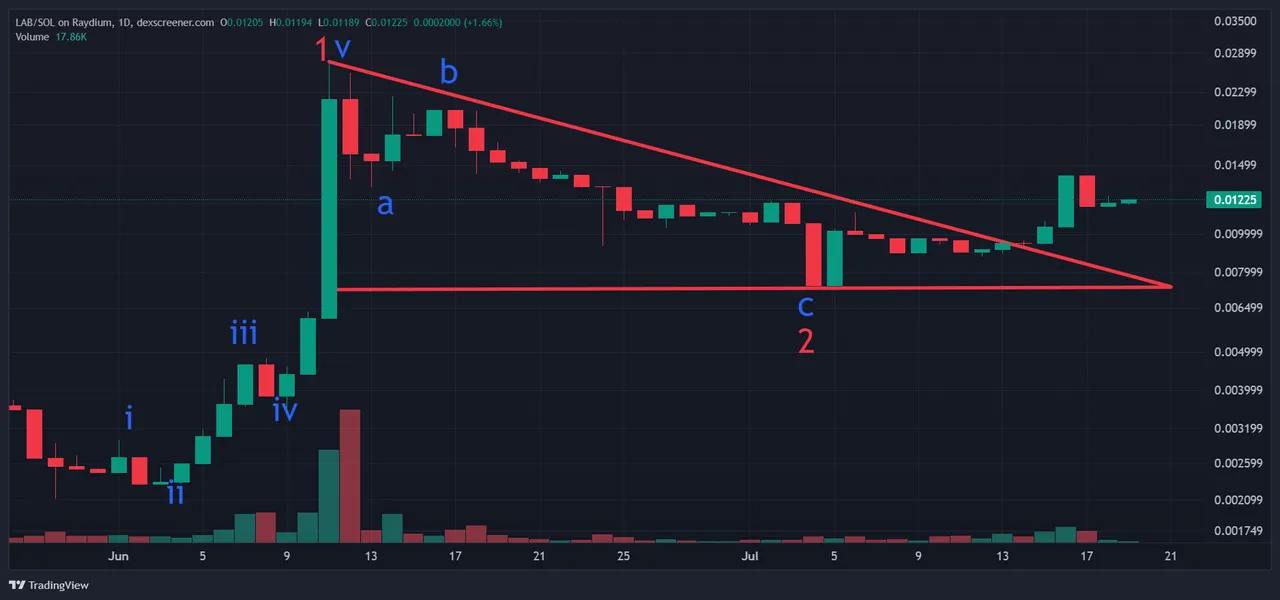
(Chart courtesy of Tradingview.com(log scale))
Funnymentals
The Professor empowers holders to shape the future of the token, fuel innovation, & reap rewards of collective success. Crypto Pandas reviewed the project two weeks ago.

(Sources: https://madlabsol.io/)
How Will The Professor Trade?
The Professor (Raydium: LABUSD) daily chart by Tradingview.
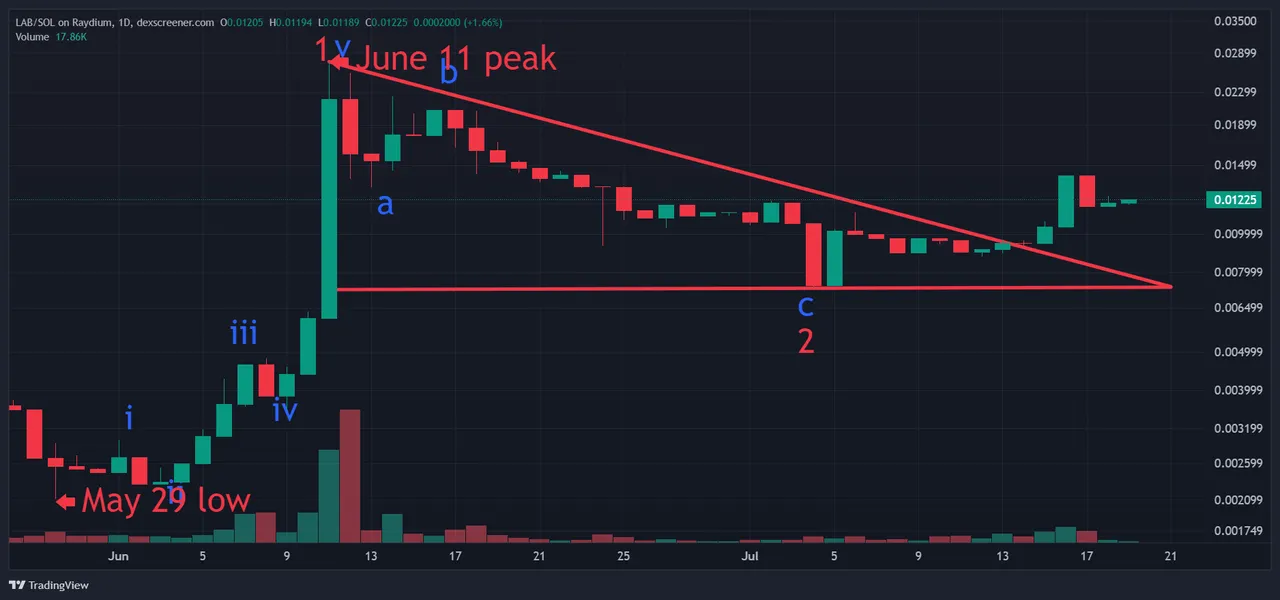
(Chart courtesy of Tradingview.com(log scale))
Prizes
I will be giving upvotes to the correct answers (posts only).
Rules
This poll will expire in one week. Only one vote per person.
Which one will happen first?
Please select one of the three choices and comment below
LAB will takeout the June 11 peak
LAB will drop below the May 29 low
LAB will stay in a trading range between the May 29 low and the June 11 peak until August 24