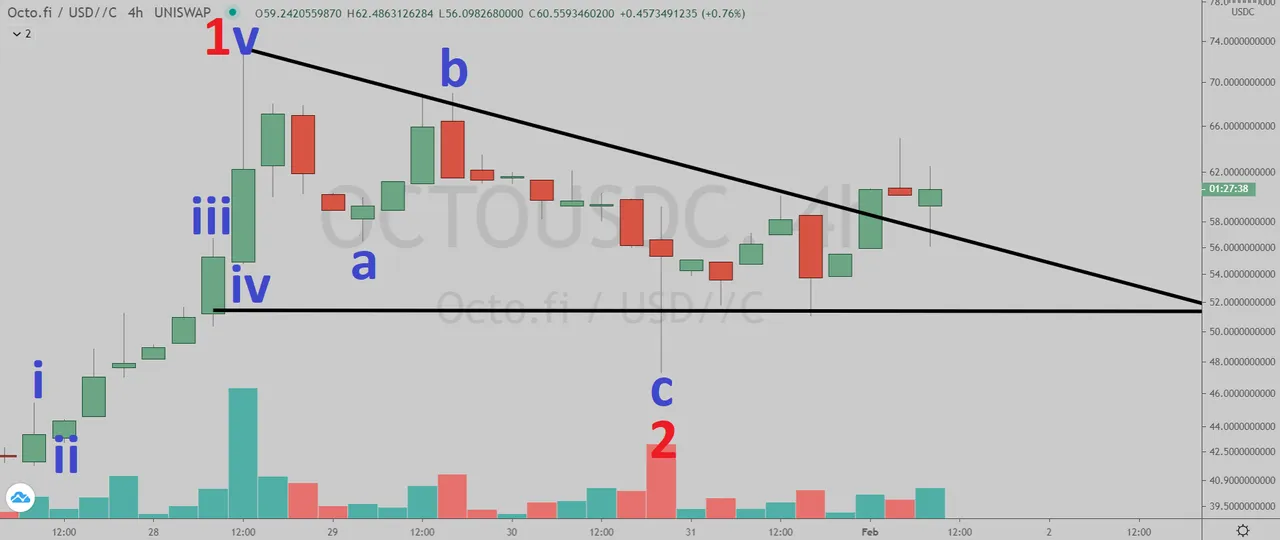
OctoFi (Uniswap: OCTOUSDC) has broken out of the triangle pattern in the four-hour chart.

(Chart courtesy of Tradingview.com (log scale))
Elliott Wave Analysis
In Elliott Wave terms, OCTO began a red wave one advance on January 27. The red wave one (blue sub-waves i-ii-iii-iv-v) peaked on January 28 and the red wave two (blue sub-waves a-b-c) correction ended on January 30. If this wave count is correct, OCTO should be heading next towards the January 28 peak in the red wave three.
(Chart courtesy of Tradingview.com (log scale))
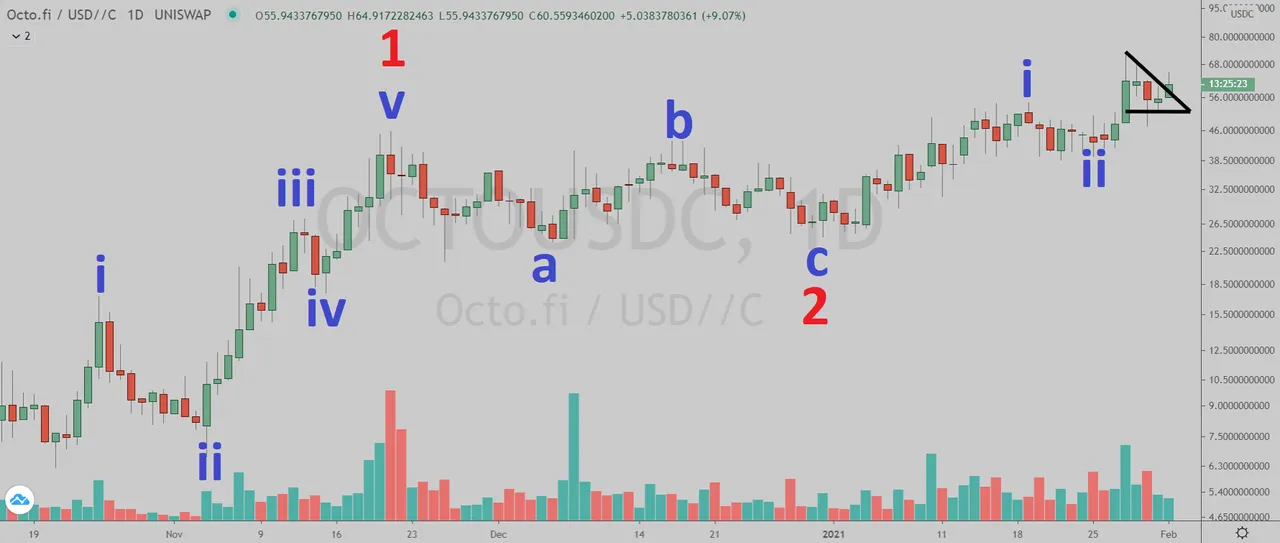
Zooming out in the daily chart, I believe OCTO is currently in the red wave three (blue sub-wave iii). The red wave one began on October 21, 2020 and the red wave two correction ended on December 31, 2020.
(Chart courtesy of Tradingview.com (log scale))
Funnymentals
OctoFi is a DeFi platform where all fees go to OCTO holders. You can watch their latest AMA below.
(Sources: https://octo.fi/)How Will OctoFi Trade?
OctoFi (Uniswap: OCTOUSDC) daily chart by Tradingview.

(Chart courtesy of Tradingview.com (log scale))
Prizes
I will be giving upvotes to the correct answers with minimum reputation of 25.
Rules
This poll will expire in one week. Only one vote per person.
Which one will happen first?
Please select one of the three choices and comment below.
OCTO will takeout the January 28 peak
OCTO will drop below the January 22 low
OCTO will stay in a trading range between the January 22 low and the January 28 peak until March 10