Cover created in Canva
As you know I am quite immersed in the world of investments and trading, I have been writing about trading for a long time here, trying to educate the community in doing things correctly regarding their holdings, so, I usually use various tools that allow me to invest in many assets, especially with cryptocurrencies, so, this time, I will share a complete and detailed review, of all the ways that exist to be able to use the MACD indicator in our favor. Don't miss it...
This publication will be divided into 5 sections, since there is a lot of content that we will see below about the MACD.


What is simply the MACD indicator?
The MACD indicator is one of the most complete indicators that we can see in the market and in the use of technical analysis. Its acronym MACD, means (Moving Average Convergence/Divergence), these terms that we can get in the meaning of its name, serve us to know in a certain way, what is its operation and what it is used for. For example: "Convergence" means that two moving averages are getting closer and "Divergence" means that both moving averages are moving away.
This indicator is used in many ways to predict the future direction of the price, its classification as "Oscillator", makes it one of the best tools to identify a trend or a reversal of it, based on this, I will detail which are the most common ways in which we can use the MACD for our benefit.
Trend identification: This indicator can help us to identify new trends in the market regardless of the time frame we are using, this is very useful, since what we all investors want is to take advantage of these trends to make money and be profitable.
Price Reversal: Another quite peculiar use of this indicator is that, with it, we can identify and predict a future price reversal, this is very useful, since, if we can predict in advance a possible trend change, we will be prepared to avoid further risks and wait for the confirmation of the reversal. A clear example of price reversal with the MACD is the use of divergences, which are a very useful way to trade the market.
Trend strength: Another usefulness of this indicator is that with it, we can measure the strength of a trend, regardless of the time frame we are analyzing, since the MACD can adapt to any time frame of the charts. This allows us to see the reliability of trading an ongoing trend or a new trend that is about to form.
Is the MACD indicator good for trading cryptocurrencies?
This is an indicator that works in all types of markets, therefore, if they work for the cryptocurrency market and more for the high volatility that these have, since, it allows us to identify formations of new trends and possible price reversals in these assets. However, we must be very careful when using it, since, like any indicator, these can give false signals, making us enter in the wrong direction and, therefore, we can get caught in such movements and lose money.
It is advisable to use this indicator in higher time frames, the signals in time frames greater than 4 hours, can be very effective and quite good to take advantage of, although the movement and displacement of the price is slower, it is here, where the patience of each investor and / or trader is tested. Of course, it can also be used in lower time frames, but, taking into account all the intrinsic risks involved in its use in the cryptocurrency market due to its high volatility.
Which is better MACD or RSI?
It is quite a good and complex comparison, both are indicators widely used in the markets by millions of investors around the world, however, in my opinion, one of them is more complete and gives me much more information when viewing charts and making an investment decision. This indicator, of course, is the MACD, since, what I can see with the RSI, which is basically the strength of a trend and the famous divergences, I can identify with the MACD. Both are in the category of oscillators, but the components of the MACD, are much more complete and based on this, to us analysts, allows us to identify in a simpler way, the future movements that could make the price, placing in a certain way the probabilities in our favor or at least a greater percentage of these.

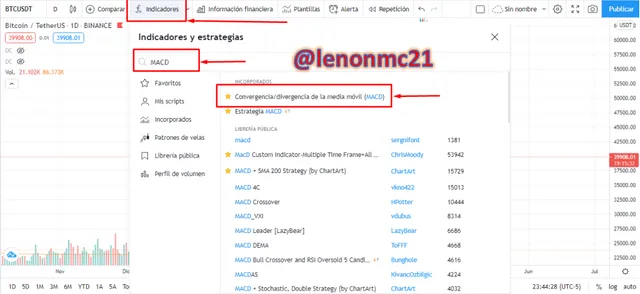
How to add the MACD indicator to the chart?
Adding the MACD indicator to the charts is very simple, for this example we will use one of the most famous platforms in the world to perform technical analysis and even connect to other brokers to trade in real time. This tool is called "Tradingview", in this, I will show the steps to add to our screen this indicator and to analyze any financial asset we want.
Next, I will show step by step how to add it to the charts:
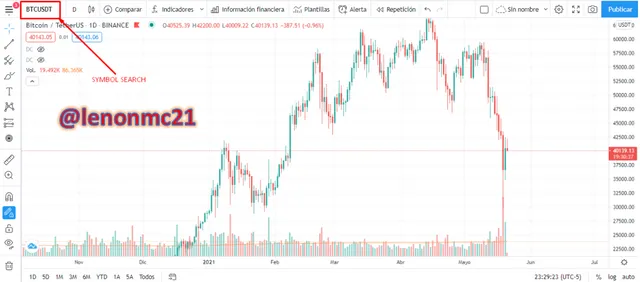
- First we go to "Tradingview" in this link: https://es.tradingview.com/
- Once we click on the previous link, we will see the following screen that I will show shortly, after this we must look at the top left of the screen, the option called "Chart" and click there.
Image by TradingView
Image by TradingView
Image by TradingView
We have already seen how the MACD indicator is composed, now we will see how we can benefit from the different configurations that we can use to take advantage of the market and generate profits: Image by TradingView
Image by TradingView
But, if we detail carefully the histogram, we can notice that when the price movement weakens, the histogram bars become smaller, which means that the trend is about to change and just when these bars cross the zero line, we will have the opportunity to enter the market depending on the direction we are working a purchase or a sale and the best thing is that this occurs long before the crossing of the MACD lines with the signal. Image by TradingView
Image by TradingView
Image by TradingView
In order to have higher probabilities of success in the operation, we must take the crossing of the MACD line and the signal line at the extremes of the indicator. This means that, if we are going to "Buy", the MACD line, must cross from bottom to top the signal line, positioning itself above this, in addition, in confluence with this, the "Histogram", must change from red to green, in short, from negative to positive, confirming a new uptrend in the temporality that we are working. To take selling positions, we must look for the complete opposite of what we said above. Then, based on this, we must take a bearish crossover at the extremes of the indicator. This means that, if we are going to "Sell", the MACD line must cross from top to bottom the signal line, positioning itself below it, also in confluence with this, the "Histogram", must change from green to red, in short from positive to negative, confirming a new downtrend in the time frame we are working. This signal is given, after the crossing of the MACD line with the signal line, after this, while the MACD line is above the signal line, we must wait for these to "simultaneously" cross the zero line from bottom to top, this will give us a "Buy" signal, to return to invest in the asset and increase our position, if we entered before, with the crossing of the MACD line and the signal line at the end of the indicator. Also, for further confirmation or security, we can wait for this simultaneous crossing of both lines with the zero line if we did not enter earlier. This signal, is also given after the crossing of the MACD line with the signal line, then, as long as the MACD line remains below the signal line, we must wait for these to cross "simultaneously" the zero line from top to bottom, this would give us a clear "Sell" signal, to return to invest in the asset and increase our position, if we entered before, with the crossing of the MACD and signal lines at the end of the indicator. Also, if we do not enter before, we can wait for this crossing for further confirmation and security, which tells us that the trend still has strength to continue.
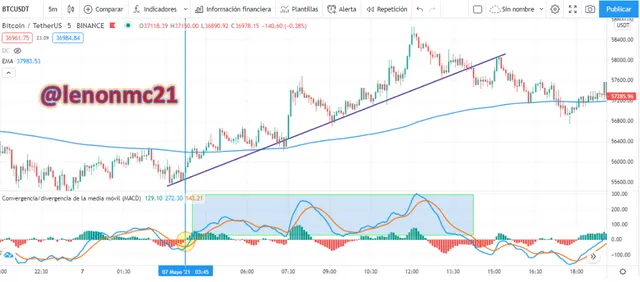
All this is allowed by the MACD and below I will explain how to detect a trend on 5 minute charts: To detect a trend with the MACD, just look for the crosses of the MACD lines with the signal line, regardless of the direction we are working, either up or down. For example: In 5-minute charts, we can find crosses in the upper pole of the indicator for an uptrend and the complete opposite for a downtrend, these trends can last from 3 to 4 hours respectively, which represents a sufficient amount of time to enter a trade, in order to take advantage of these micro-trends that are formed in lower timeframes. Another way that can help us to detect a trend in confluence with the crossing of the MACD and signal lines is the histogram. The histogram is represented by bars that measure the strength of a trend, with it, we can determine when a trend is about to end and when one is about to start, because, for example: If the histogram bars are getting smaller and smaller, assuming that we are in a downtrend, we interpret this as, the downtrend is weakening, which would bring as a consequence that, the bars of the same are about to change, from negative to positive, starting to form green bars, it is at this moment that, we can start looking for purchases, while the new uptrend is gaining strength. Finally, to confirm that we are in an uptrend, the MACD and signal lines must be above the zero line, since the longer they remain above this zone, the longer the trend will last. Now, the opposite happens for a downtrend, in this sense, while the MACD and signal lines are below the zero line, the trend will be downward and the longer they stay below this zone, the longer the trend will be prolonged. Image showing an bullish trend TradingView
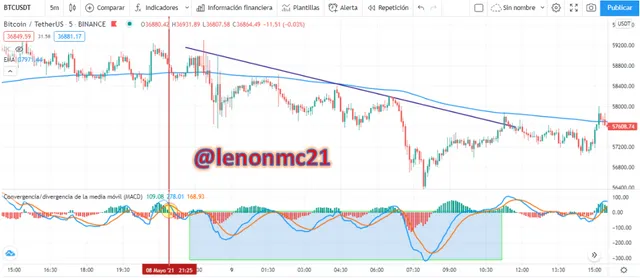
Image showing a bearish trend TradingView
Image by TradingView
Image by TradingView
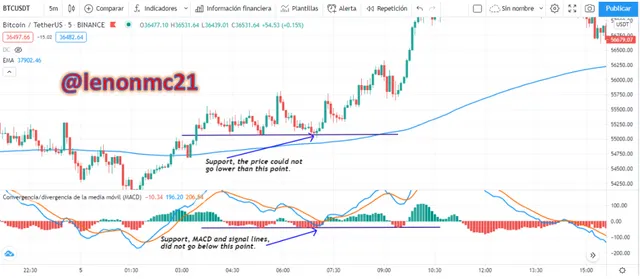
In order to understand more clearly, I will show some examples of how the MACD and signal lines, show us these important points of support and/or resistance on the chart: Image by TradingView
In order to validate a resistance with the MACD indicator, as I mentioned before, we must be aware of the main lines of the MACD and signal. For example: In the previous image, we can see that both lines have a clear rejection at a certain point, preventing the price to continue rising, if we look closely the trend in this example is bearish, in addition, I could draw a horizontal line, joining the points where the MACD lines and signal rejected, which indicates that there is a clear resistance preventing the price to continue rising. Now looking at the chart, I can draw this same horizontal line, right where the MACD indicator signals me that there is resistance, this allows me to validate this area and if we look at the chart, clearly the price could not go up and continued its downward trajectory. Image by TradingView
Now in the previous image, we see an example of how the MACD and signal lines, react at the same point at the bottom of the indicator, while the price was going down, based on this, I could draw a "horizontal line", joining these points, where the MACD and signal lines were rejected to the upside, validating a support. Then if we look at the chart, we see that the same point in confluence with the MACD, the price stopped and could not continue down, confirming the existence of a support in that area. If we look at the price after this it started to rise in conjunction with our MACD and signal lines.
I hope this complete review of the MACD will help you in trading the many assets that exist in the financial world, this can serve as a guide for those who are starting out in trading and wish to learn, in detail, a versatile indicator that adapts to any type of movement in the markets. Enjoy.... Atte. @Lenonmc21 If you are new you can join the game under this LINK
What are its configurations and how to benefit from them?
To begin to detail the configurations of the MACD and how to benefit from them, we must first know what components it brings and thus be able to understand the operation and purpose of each one on the chart and how they generate positive reversal signals. So, based on this, the MACD is formed by the following indicators:MACD line: the line called MACD is an essential part of this indicator. It is made up of two EMAS, one of 12 and the other of 26 periods, then the subtraction between these two EMAS, results in the blue MACD line that we can see in the indicator.Signal line: This signal line is a 9-period EMA and it is always oscillating together with what is the MACD line, together they usually generate bullish and/or bearish reversal signals.Histogram: This histogram allows us to identify in a certain way the strength of a movement in the market, it is also a way to look more directly for the displacement left by the MACD and signal lines and of course, of the price.Zero Line: This line represents the central line and / or average of the histogram that makes up the entire indicator, representing the zero value of this and also means that when the signal line crosses it, the difference between these is ZERO.Crossing of the MACD line with the signal line: This is the primary configuration that any investor knows and that we can find in the MACD indicator, we will simply look for buying and/or selling opportunities with the crossing of these lines.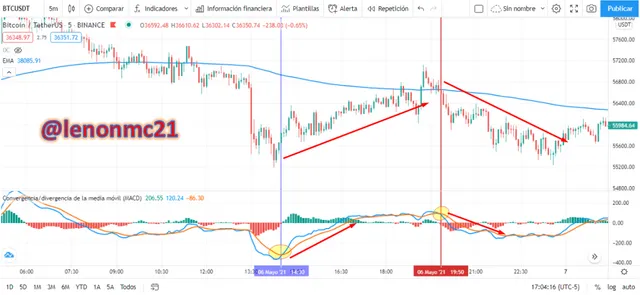
Crossing of the MACD and signal lines with the zero line: This is the second configuration that we can use to be able to generate purchases and/or sales in the market. It is simply that both lines simultaneously cross the middle line (ZERO) and just at that moment of crossing, we can enter the market with purchases and / or sales, depending on the holding that we are working at that time.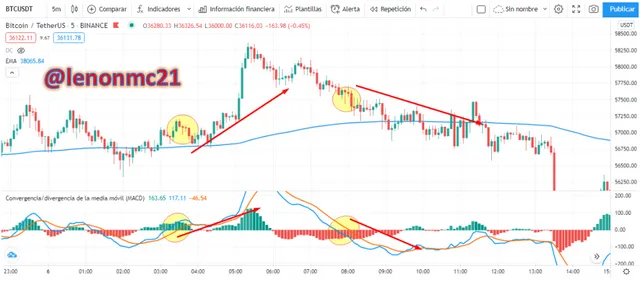
Signals of investment with the Histogram: Another of the ways in which we can use the MACD for our benefit, is to use the Histogram to enter purchases and/or sales depending on what we observe. Generally in the temporality that we are working, the histogram for each candle that forms the price, generates a bar, these bars of red or green color, depending on the direction of the price, are formed and become larger if the trend is strong and decided in a certain direction.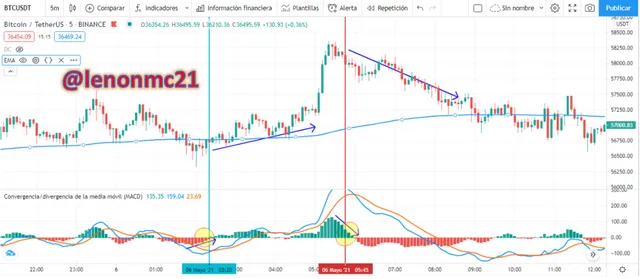
Divergences with the MACD indicator: Another incredible way to benefit from the MCAD indicator are the divergences. Basically we can obtain important investment opportunities if we can correctly identify them. Based on this I will detail when a bullish and bearish divergence occurs:
Bullish Divergence: This occurs when for example we are facing a downtrend on the chart, but the MACD line and the signal line, present a continuous growth from their lows, this will allow us to draw a trend line just when we see this action in both the price and the indicator, in that sense, in the graph, we paint a bearish line, joining the lower and lower lows in the price, but in the MACD, the line that we should paint, would join the higher and higher lows, left by the MACD and signal lines, thus showing the weakness of the uptrend, where there are higher probabilities that the price reverses.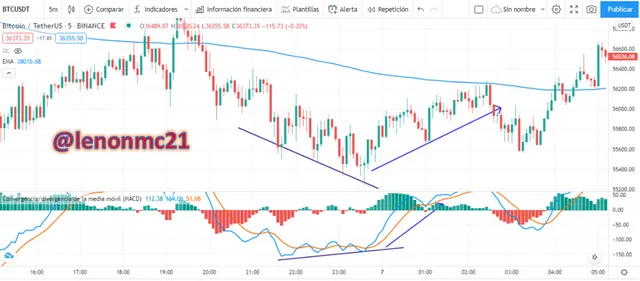
Bearish Divergence: This is when the opposite of bullish occurs. At this point the price is in an uptrend, so we can join the maximum points that the price has left with a line. Subsequently, we turn to the MACD and see that the MACD and signal lines from their highs, make lower and lower highs, so this indicates that the current trend is weakening and if we paint a trend line on the MACD and signal lines, we see that they point down instead of up, confirming the weakness of the current trend.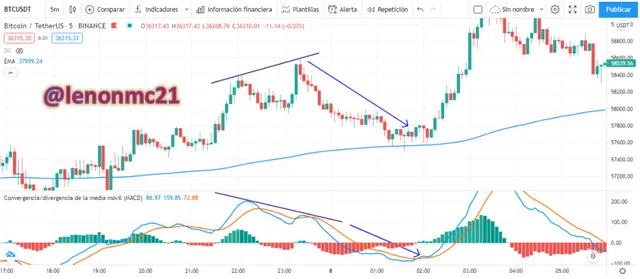

How to use MACD to cross the MACD line and the signal line?
In this section, we will see examples of how to take winning trades using the main crossing of the MACD line and the signal line. To take a trade, with the highest probability of winning with it, we must take into account the following:Buying:Sales:How to use the MACD with the zero line crossing?
There is another way to use the MACD to be able to look for trades, both buy and sell. This signal represents the continuation and strength of a trend regardless of the direction we are working. In this sense, to look for a trade with the zero line crossing, we should look for the following:Buy:Sales:

How to detect a trend using the MACD?
To detect a trend using the MACD indicator, we must be very attentive to certain elements that compose it, this will give us a signal that a new trend is about to start. Of course, the strength of the trend and how long it lasts will depend on the time frame we are working with at the time. Some investors will not be patient enough to take a trend that can last several days, weeks or even months, but prefer to execute much shorter trends that can last minutes or hours in the market. On the contrary, there is the other side of the coin, where there are investors with patience who prefer to wait for a longer trend and thus increase their profits with a single trade.
How to filter false signals?
To filter out false signals using the MACD is very simple. Previously I commented in an example, how to look for 5 minute micro-trends with the MACD, however, in my experience this is a quite risky time frame and it may be that the crossover or histogram change that we are expecting is nothing more than a deception, making us lose money. So, in order to filter the signals and place ourselves on the side, where the probabilities of success are higher, we should do the following:Trade in favor of the general trend in high timeframes: If we want to look for the highest probabilities of winning with the MACD and not to find false crosses that make us lose money, we must focus on analyzing timeframes of at least 4 hours. It is important to keep this in mind, since, from this time frame onwards, we will find the general trend of the asset we are analyzing, then, if we are in a downtrend, for example in 1 day charts, we should only look for crosses from the upper end of the indicator, where the MACD line is crossing from top to bottom the signal line, in this way we will be taking trades in favor of the trend without taking into account the bullish crosses.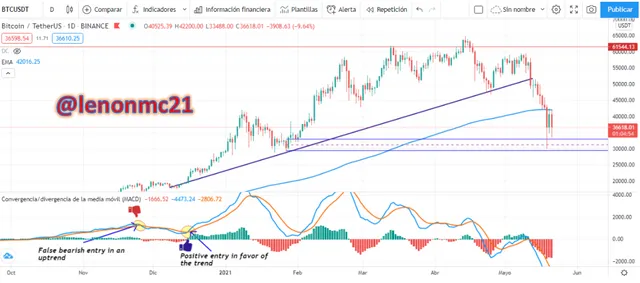
Use a 200 period EMA: Another very useful way to filter false trades, where it would not matter the time frame we are using, is to add to our chart a 200 period EMA. It works in a very simple way, pay attention, if the price is below our 200 day EMA, then we will only look for down trades and discard the up trades, since, with this we know that the highest probabilities are to the downside. If, on the contrary, the price is above the 200 EMA, we will only look for bullish entries, discarding all the bearish crosses we see, this way we only look for trades with the highest probability of success, following the trend.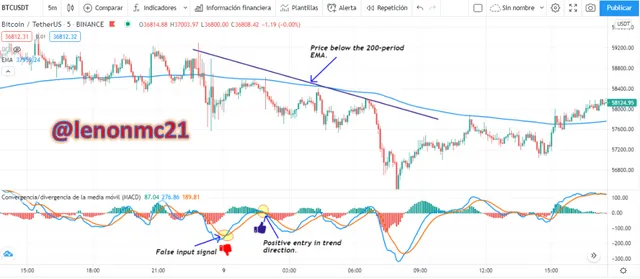

How can the MACD indicator be used to extract support and resistance points or levels on the chart? Use an example to explain the strategy.
In order to identify support and/or resistance levels on the chart using the MACD, we only need to pay attention to our 2 main lines that make up our indicator. I refer to monitor the behavior of the MACD lines and the signal line, because, depending on how the price is moving, the lines will react accordingly, showing us points where the price has turned around, meeting either support or resistance.Resistance: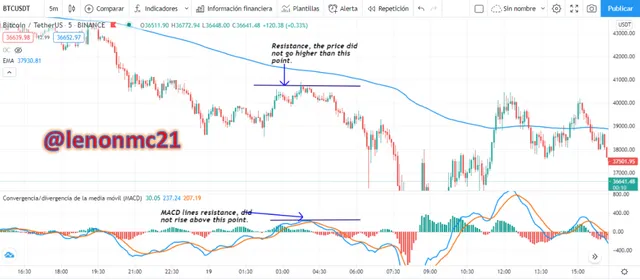
Supports: