Authored by: @hetty-rowan

Early bird today
It's Sunday again, and after an intensive Saturday I fell asleep very early on Saturday evening, which means that I am also early today to put my blog online. And not for one reason or another, but it just feels good when I'm so nice and early.
There have been plenty of times when I've been up so early every day, and those were the times when I was most productive, blogging every day.
So, now that I'm up so incredibly early again today, let the creative bloggers juices flowing. And let's take a different angle to look at Bitcoin!
We are all hooked to the 4-year cycle! But is that really so? Today we'll take a look at another interesting theory that I came across. And of course I'd love to hear your opinions after reading the post.
Bitcoin: Another theory!
Every investor has to deal with this. After countless videos on YouTube, and various other sources on the internet, you will discover investment opportunities that suit you. Your money is invested and in the first weeks it is already easy! The price rises by tens of percentages, and your confidence in your choice increases by the day. Where is this going? To the moon!
Until the day of the big drop. Panic strikes in the market and questions arise within yourself as well. Is this the bottom? Are we going to drop even further? Will there be a ban in China? Do I have to sell everything? The life of an investor is not a bed of roses.
Sell at a loss
For many investors, this is a short summary of what their adventure with, for example, Bitcoin (BTC) looks like. The saddest part is that they often sell their investment at a loss out of fear. To survive all the hard drops along the way, you need to be able to keep your emotions in check.
However, this is the most difficult aspect. A correction in the market is an intense period in which the negative news that accompanies it often additionally confirms your emotions. HODL always sounds logical, but it is a very difficult game mentally. To survive these kinds of periods, and thus to secure your profits, to limit your losses, it is important that you learn a lot about crypto in general.
The influence of social media on investor expectations
For many investors, sticking to one theory is a common pitfall. Due to the influence of various influencers on social media, an image is created that, for example, Bitcoin is worth hundreds of thousands of euros.
Huge amounts of investors are watching these videos and in times of big price increases, the conviction seems to be growing by the day. Sticking to your own vision is very important, especially if you have done good research. However, an investor must also be very flexible in his vision. Everyone wants to sell at the top, this is only reality for very few people.
The 2017 bull run is an example of this, about 1% of all sales happened around the top. Most sellers became active when the price of Bitcoin had already almost halved around $10,000.
The popular theories about the Bitcoin price trend
The halving is important in many theories for determining future price targets. With a halving, the reward for mining Bitcoin is halved. Between 2016 and 2020, the reward for mining was 12.5 Bitcoin per block. However, on May 11, 2020, this was halved to 6.25 new Bitcoin per block.
The halving cycle
In this theory it is assumed that the halving creates the same pattern in the price trend. This theory is based on the previous halvings that took place in 2012 and 2016. After the halving, there was a period of enormous growth, only to fall again.
Then the price consolidates until the next halving. Then the cycle starts all over again. Since Bitcoin is relatively new to the market, investors have few targets. Therefore, this theory is very popular. The theory is clear, logical and hopeful! The majority of investors are therefore very focused on this theory.
The stock-to-flow model
A variant of this is the stock-to-flow model. Again a theory based on the halving and calculated by a Dutch econometrician. This model focuses on the scarcity of Bitcoin, by looking at the total amount of Bitcoin available and the amount of Bitcoin that is mined in circulation. This model is also very clear, logical and hopeful.
Yet there is also danger lurking. The majority of investors have therefore assumed that around December 2021 Bitcoin will peak for this bull cycle, often quoted as $288,000, based on the calculation of the stock-to-flow model. The maker of this model has even indicated that the price will go higher in this bull cycle.
Because many investors focus on this model, it is wise to be careful! This certainly does not mean that the mentioned models are wrong, and you can throw them in the trash! However, a different view of the course is also important. Everyone wants as much return as possible and not to miss the boat, but it still happens to most investors.
Thinking outside the box!
That's why it's never wrong to think outside the box. Suppose we are in a 6-year cycle? Yeah, I know this sounds insane! There is no fundamental basis for a 6-year cycle, let alone a pattern based on the previous bull runs... right?
Here we go
A different cycle means that you are on a different track than the majority. This also means you don't have a crystal ball, but a different view can give you extra options. Just as the 4-year halving theories are based on historical price action, so is the 6-year theory.
This theory looks at the bull cycle of 2013. This bull cycle is characterized by a double bull run. After the initial run, Bitcoin went into a bear market for nearly six months. After this period of uncertainty and frustration, Bitcoin climbed back to the moon and made a new high.
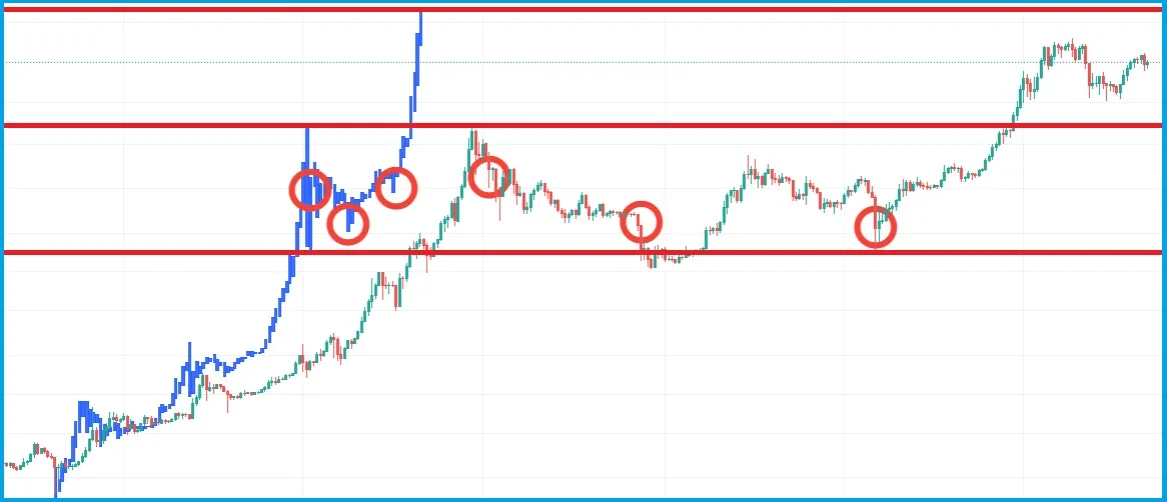
To discover what makes this bull cycle so special, we look at the logarithmic scale. This scale provides a clearer view of the price trend. This scale can be very useful to recognize a trend. A pattern is visible on the logarithmic scale, which represents the 6-year cycle. An image of this follows later in this article.
If you look at both parts of the bull cycle from 2013, a pattern can be recognized that is very similar to the years after. The first bull run of 2013 is very similar to the complete run of 2017! This resemblance could, of course, be purely coincidental.
However, the similarities go further. After a hard drop in Bitcoin's price in early 2018, the price is consolidating. Eventually the capitulation follows, and the price then rises again until the third crash, where the price drops enormously but still manages to realize a higher low.
After the third correction, the market recovers and the new bull run begins. This price build-up in the bear market - where there are three huge declines and the third makes a higher low - is very similar to the accumulation phase of the 2013 bull cycle.
How far are we in the 6-year cycle?
If this copy of the 2013 bull cycle continues to evolve, this alternative view of the price could become reality. This would mean that after one big price increase, we already have the top in sight. A top of a bull cycle is characterized by a parabolic phase. If Bitcoin actually goes to the moon in the very short term, it could just be that the 6-year cycle predicts the top of the bull run.
The 6-year cycle is also underpinned by a number of factors. Besides the fact that the trend line seems almost identical to 2013, there are several indications that the top is near. For example, the Bitcoin Dominance seems to be following the same route as in 2017. A huge decline followed by consolidation and then another massive decline marked the Bitcoin Dominance price in 2017. In 2021 we have not yet had the last drop in dominance. So far, altseason has mostly taken place around the top of the Bitcoin price.
What will happen after Bitcoin's peak?
The hallmark of previous bull cycles is a very deep drop after the top has been reached. Due to the preset buy orders and the traders who want to buy the dip, the price rises, but this is short-lived.
The price enters a so-called 'dead cat bounce' and in this downward trend the price falls deeper and deeper. Bitcoin is disappearing from the news and for many investors Bitcoin is no longer an interesting investment. The period of price declines and accumulation used to last for years. But is that also the case this time?
If the price makes a new high and then makes a correction, it would mean that the price targets of, for example, the stock-to-flow model have not yet been met. For many investors, this may be new hope to buy in quickly and be prepared for another upward move, thus avoiding a long bear market as before.
Bitcoin adoption is increasing among countries and companies
In addition, the developments surrounding Bitcoin also play a role. Previously, Bitcoin was especially interesting among individuals and investment companies. However, this bull run has shown that Bitcoin adoption can grow many times over. For example, Elon Musk owns Bitcoin, and we all know that his companies SpaceX and Tesla also have Bitcoin on their balance sheets. And many more influencers have boarded the Bitcoin train.
Countries are becoming more and more positive about Bitcoin
Countries are also openly expressing their plans regarding Bitcoin. The knock-on effect of this is slowly becoming visible as more and more countries express themselves positively about Bitcoin. The more countries accept Bitcoin as a means of payment, the more people become acquainted with the digital currency.
Recently, El Salvador gave all residents the option to receive $30 worth of Bitcoin from the state. This historic event was followed by positive reports from Cuba, Panama, Ukraine and Nicaragua, among others. Before that, Iran was already actively involved with Bitcoin.
Who's next after Tesla?
If, for example, Facebook, Apple or Amazon announce that they accept Bitcoin as a means of payment or have Bitcoin on their balance sheet, there is a possibility that the price will rise just as it did after the announcement of Elon Musk. In addition to the increasing adoption of countries and companies, there is another aspect that drives many investors towards investments such as Bitcoin, gold and real estate.
Inflation causes purchasing power to decline, investors try to counteract this decline by investing their assets. Due to the potentially relatively fast and high profits, the crypto market can become very interesting for wealthy individuals. Bitcoin has proven to rise faster than inflation since its inception.
Find out what the top of the 6-year cycle theory is!
Curious about the price target of the 6-year cycle? It is possible to create the 6-year cycle yourself in Tradingview. First of all, it is necessary to find a chart where the price goes all the way back to the 2013 bull run. It is advisable to take the price of an old exchange or an index.
Then you put the price on a logarithmic scale, this can be done by clicking the 'log' button at the bottom right of the chart. Then provide an overview in the chart, this can be done by sliding the price and date. Then click on the 'Long Position' icon at the icons on the left. Then open a menu. In the menu that opens it says 'Bars Pattern', you must have this.
After selecting the Bars Pattern, first click on the bottom of the 2013 bull run, then on the peak. Now that the price has been copied, you can shift it to the 2017 bottom and discover the price target of the 6-year cycle!
Conclusion
Many investors start investing when the price is rising and panic at a correction. On the basis of popular models and widely viewed videos, a certain picture is often painted, whereby Bitcoin will just reach very high highs.
With this in mind, an unexpected price drop is even harder to get through. That's why I challenge you to think outside the box, like the example in this article. The 6-year cycle is a theory that is substantiated in a different way than the 4-year theories.
Time will tell how Bitcoin continues to develop, but based on historical data, this 6-year cycle is in any case an interesting and special way to analyze the price.
I'm very curious what you think of this 'out of the box theory'?
