These days a version is circulating that the price of Ethereum could rise as it did in 2017 (I do not want to excite or scare you, even less to provoke a sly smile, but at that time it increased its price by almost 7000%).
In trading jargon, a fractal is a tool that helps in predicting a reversal to a previous trend, in this particular case in the aforementioned behavior of the Ethereum price.
In the plot of this cryptocurrency, at the moment and according to the experts, four technical patterns would be reproducing almost with absolute accuracy, which was the ones that caused that fabulous rise to take place in that year.
I am not going to go into technical considerations that exceed my knowledge and expectations, I only mention the similarity in the conditions and that they could be indicating a large rise in the price. Regardless of whether or not the reader believes in fractals, the idea is in the air, and in many cases, only one spark is enough to ignite a gigantic fire.
But still, if you didn't notice, I still need to talk about the hammer.
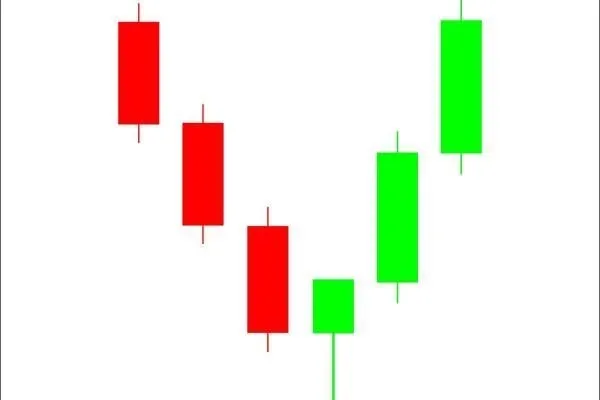
This pattern is nothing more than the drawing of a short candle with a long wick going down on a trading chart; By definition, this pattern can be by itself a strong indicator of the bullish behavior of an asset and within the four indicators of the mentioned fractal, this is probably the most important.
Therefore, friends, I am going to put some chips to Ethereum, lest the hammer hit with all its might and jump the bank.
Don't say I didn't warn you.

Por estos días circula una versión sobre que el precio de Ethereum podría subir como lo hizo en el año 2017 (no los quiero ilusionar ni tampoco asustar, menos todavía provocar una sonrisa socarrona, pero en ese momento aumentó su cotización en casi un 7000%).
En la jerga del trading, un fractal es una herramienta que ayuda en la predicción de una reversión a una tendencia anterior, en este caso particular en el comportamiento ya mencionado de la cotización del Ethereum.
En la trama de esta criptomoneda, en estos momentos y según los expertos, se estarían reproduciendo casi con exactitud absoluta cuatro patrones técnicos que fueron los que provocaron que en aquel año se produjera esa fabulosa alza.
No voy a entrar en consideraciones técnicas que exceden mis conocimientos y expectativas, solo menciono la similitud en las condiciones y que ellas podrían estar indicando una gran subida en la cotización. Independientemente de si el lector cree o no en los fractales, la idea está en el aire y en muchas ocasiones solo basta una chispa para encender un gigantesco incendio.
Pero aun, si no se dieron cuenta, me falta hablar del martillo.
Este patrón no es otra cosa que el dibujo de una vela corta con una mecha larga a la baja en un gráfico de trading; por definición, este patrón puede ser por si solo un fuerte indicador del comportamiento alcista de un activo y dentro de los cuatro indicadores del fractal mencionado, este es, probablemente, el más importante.
Por lo tanto, amigos, yo voy a poner algunas fichas al Ethereum, no sea cosa que el martillo golee con toda su fuerza y salte la banca.
No digan que no les avisé.
Las fotografías son de mi propiedad excepto las que menciono la fuente.
The photographs are my property except those mentioned by the source.
Héctor Gugliermo
@hosgug