
#Bitcoin (BTC) dropped 2.45% yesterday and closed the day at $44,400. BTC/USDT, whose closing price is promising, started with buyers during Asian trading hours today.
First, let's look at the Bitcoin Daily chart and check the status of the trend in the overall framework.
Daily Bitcoin Chart
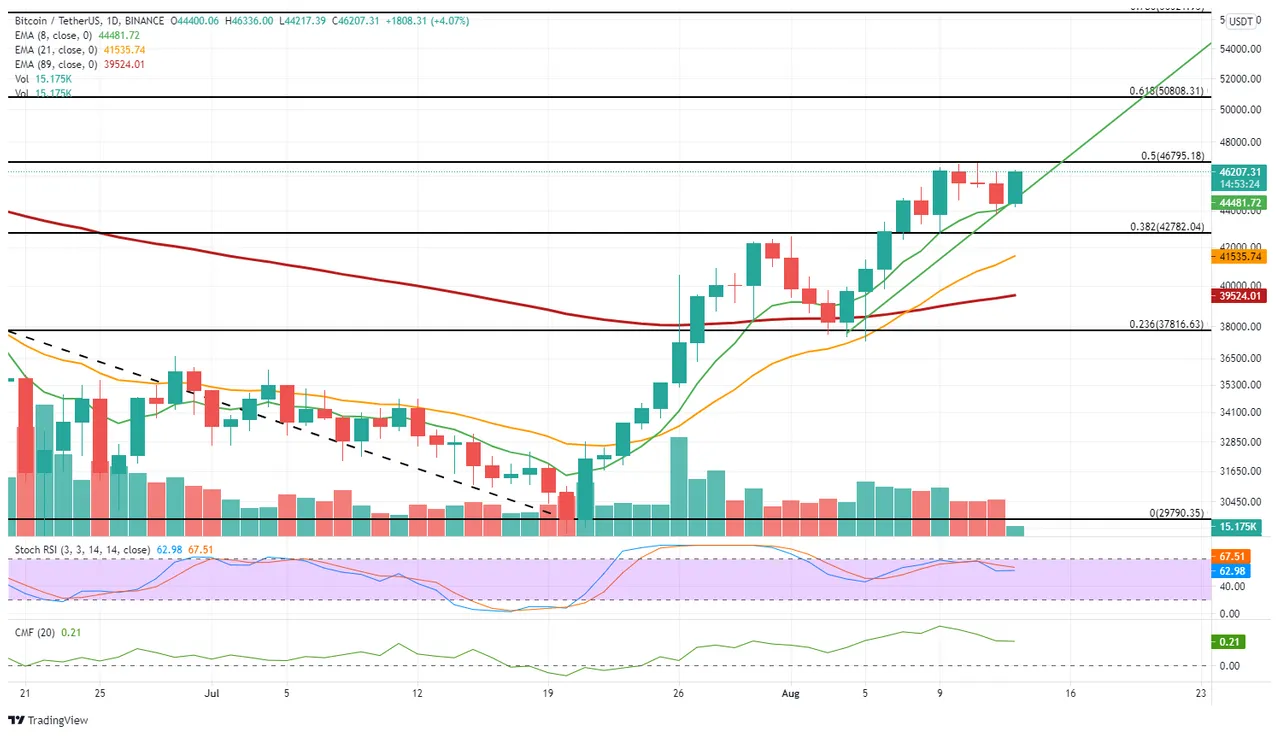
On the daily chart, yesterday's closing price shows support at the 8-day EMA (44,000). This is an important sign that the trend that started on August 4 has not broken down yet. The support from this point helped BTC to recover and the resistance at $ 46,800 came up again. So, can this resistance be overcome this week? If passed, what is the target?
There was a limited correction from today's bullish trade on the 10th – 12th of August, showing that the bulls are gathering strength. In the daily view, the stochastic RSI has not yet entered the oversold territory. The possibility of entering this area and moving sideways indicates that higher values can be reached in #BTC. Also, the CMF, which shows the capital direction, is in the positive zone and horizontal although its slope is downward.
Hourly closes above 46,800 today may strengthen the uptrend further and we can see BTC/USDT continue on its way with a target of $50,800.
As a result, as seen on the daily chart, the ultimate goal of the bulls is to pass $46,000 smoothly.
Let's take a closer look at Bitcoin on the 3-hour chart and try to identify intermediate support and resistance levels.
3-Hour Bitcoin chart
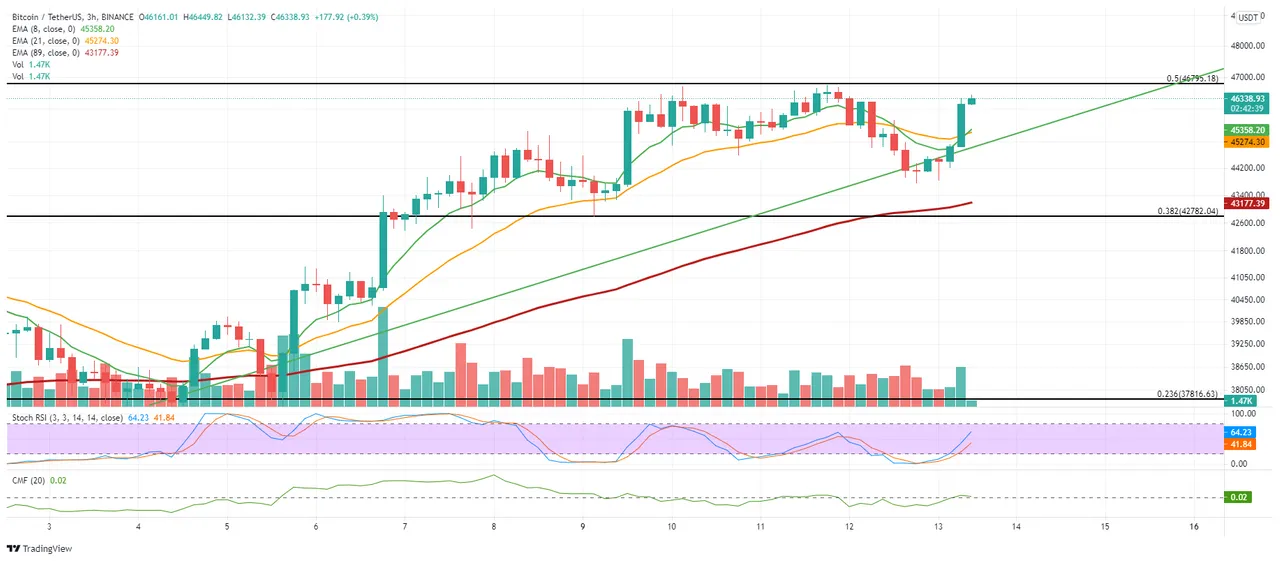
In the 3-hour view, we come across important signals for bullishness. Starting the day with a buyer in the Asian region, BTC passed the 8 and 21 EMA (3-hourly) values at $45,100. With this crossover, the 8 EMA is attempting to rise above the 21 EMA again, which can be interpreted as an important bullish signal.
The stochastic RSI, which reached oversold in the short term with the price drop yesterday, turned its direction up again. This can be seen as a positive signal for BTC price rise. It also reflects the funds entering the Bitcoin market by moving into the positive territory of the CMF in the 3-hour period.
In the lower zone, the $45,200-$300 band will be followed as an important support area, and hourly candle formations below this level may push BTC below $43,000. On the other hand, as I mentioned above, $ 46,800 remains the most important resistance of this week.
Thank you for reading! If you liked the analysis, you can show your support and get more Bitcoin and altcoin analysis published.
Disclaimer: The information in the content is not an investment advice. Author is not responsible for your profit or loss. Every investment involves risks and requires knowledge.