
Ethereum (ETH) closed the day negative only 4 times in its 23-day bullish period. Three of them arrived this week.
Ethereum, which has been rising steadily since July 21, passed the current resistance levels without any problems and we saw the trend turn sideways when it reached the most important resistance point. After falling as low as $1,700, the ETH/USDT pair first surpassed the average price of $2,400, which it was unable to break before. Then, the resistance zone at the $2,800 band was quickly passed. Now, the bulls are facing the $3,250 resistance, which will set the new direction of the trend.
Daily Ethereum Chart
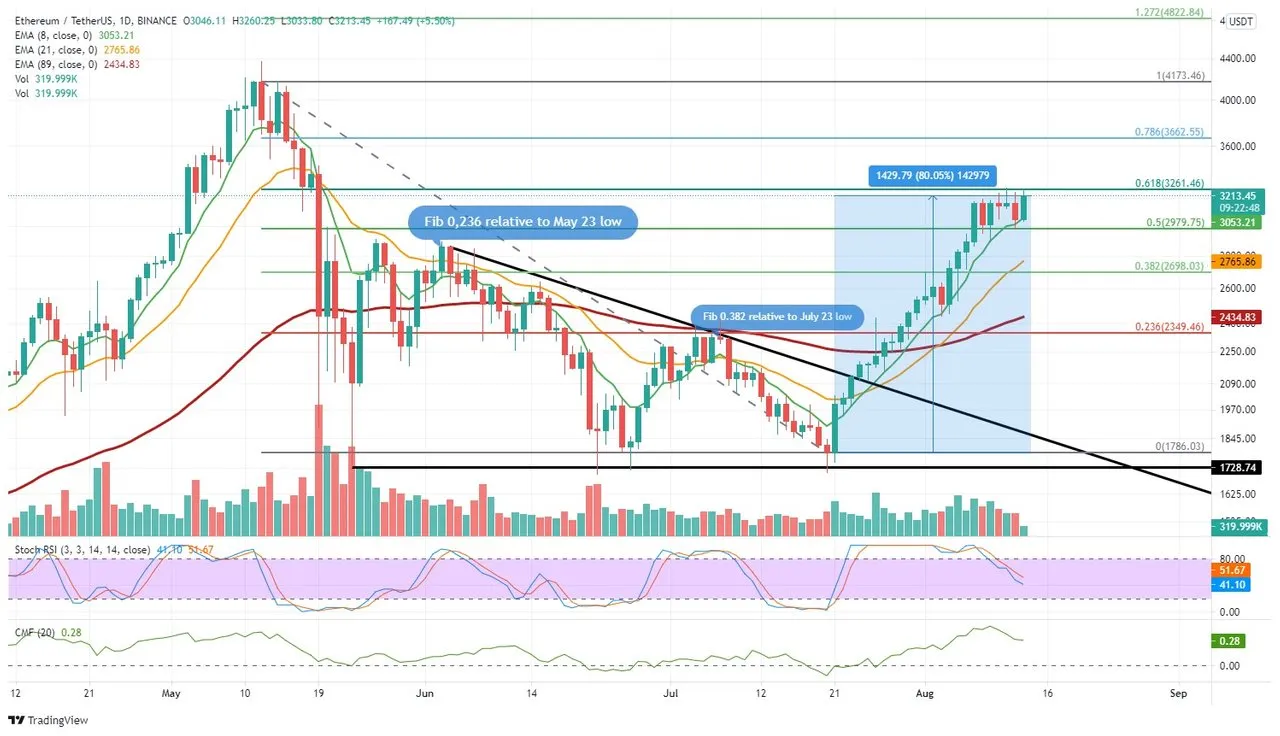
The ether price, which has been stuck in the $3,000 – $3,250 band since August 7, may determine its new direction this weekend. Measured against the last high close price of 3.823 and the last low close price of 1.786, it coincides with the average $3,250 Fib 0.618 retracement level.
A day close above $3,250 could trigger a rise to the new target of ETH/USDT at $3,650 (Fib 0.786). However, the fact that this resistance has not been broken for a week causes a question mark? Could a new bearish wave come from the Fib 0.618 region, which is an ideal retracement level for the downtrend?
This is technically possible, but the positive mood in the market may prevent a possible decline from being limited and higher lows. Looking at the daily chart, there is a mismatch between the stochastic RSI and the price chart. As the uptrend continues, the stochastic RSI has turned south. In addition, the CMf, which shows the capital movement, has lost its slope although it is in the positive zone.
If we add the resistance point that has not been broken for a week to these two important indicators, the possibility of a correction outweighs. So, where are the support points in a possible decline?
The first dynamic support price is the 8-day EMA, currently positioned at $3,055, moving in line with the trend. It is also a support price in line with the $2,950-3,000 (Fib 0.50) area, with buyers equipping Ether on this week's dips.
If there is a drop below $2,950, we could see a pullback to the $2,700 band. This price zone is also supported by the 21-day EMA and Fib 0.318.
Except for this bearish scenario, if the $3,200 band is passed smoothly with the arrival of new buyers in the Ether market, that is, if we can see an opening-closing candle above $3,200, it will most likely continue and the target will be the final ATH $4,372 after the $3,650 (Fib 0.782) resistance.
Thank you for reading! If you liked the analysis, you can show your support and get more Bitcoin and altcoin analysis published.
Disclaimer: The information in the content is not an investment advice. Author is not responsible for your profit or loss. Every investment involves risks and requires knowledge.