
It's no secret that I have made a LOT of bad calls over the years when it comes to the spot price of Bitcoin. Much like the Inverse Cramer rule, so too were there jokes of the Inverse @edicted rule for a while. Everything I would say, the opposite seemed to happen. It was crazy! The market was in my head.
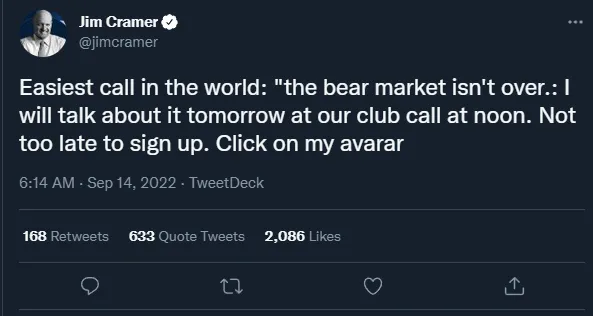
The Inverse Cramer is on my side today!
I mean he's not wrong. Obviously the economy is teetering off the side of a cliff, but at the same time, looking at the rampant bearishness that came after the dreaded CPI report, I feel like it's almost guaranteed that the market moves up in the short term. At least for the next week, we probably don't have anything to worry about.
And even though I get it wrong a lot of the time, especially on short-term timespans, I did call the end of the 2018/2019 bear market perfectly. In fact... not only did I call the end of the bear market at exactly the right time, but also I created the doubling curve trendline in the exact same post... was calling it Moore's Law support back then.
March 29, 2019: Bitcoin Keeps Bouncing Off Moore's Law Support
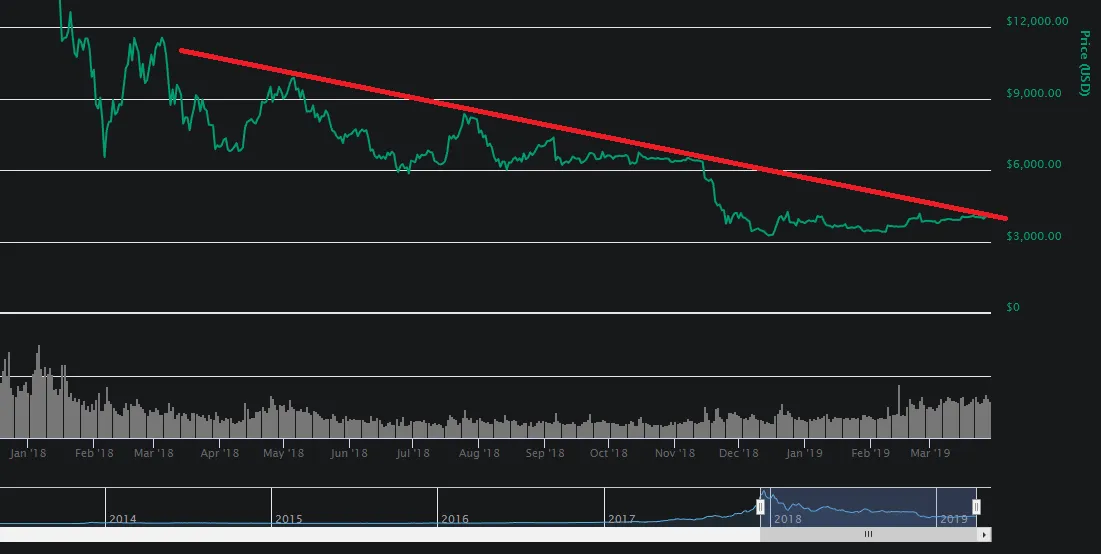
Bear market ends when macro resistance gets cracked.
Basically when the doubling curve passes through the macro resistance we get a huge pump and a new rally begins. However, the doubling curve that I usually draw is already sitting at $40k, so that line is a bust... however...
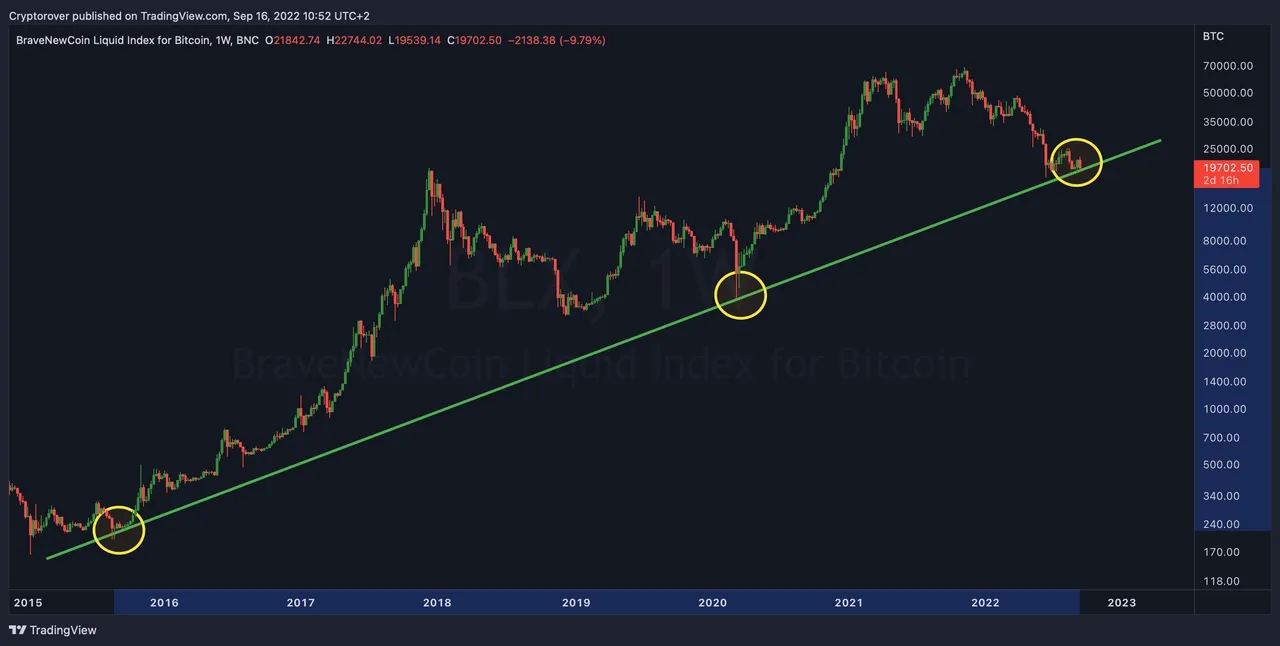
This is an interesting line that saw on Twitter.
Essentially bulls holding out hope that we are about to start a rally.
Just like me I guess!
The interesting thing about this trendline is that it has the exact same slope as the doubling curve I talk about all the time, it's just one year behind. Instead of it being at $40k it's at $20k at the moment. Could this line signal a rock-bottom market and the one a year ahead is more accurate during legacy bear markets? Possible. Definitely something to keep an eye on considering how accurate the doubling trendline has been since 2013.
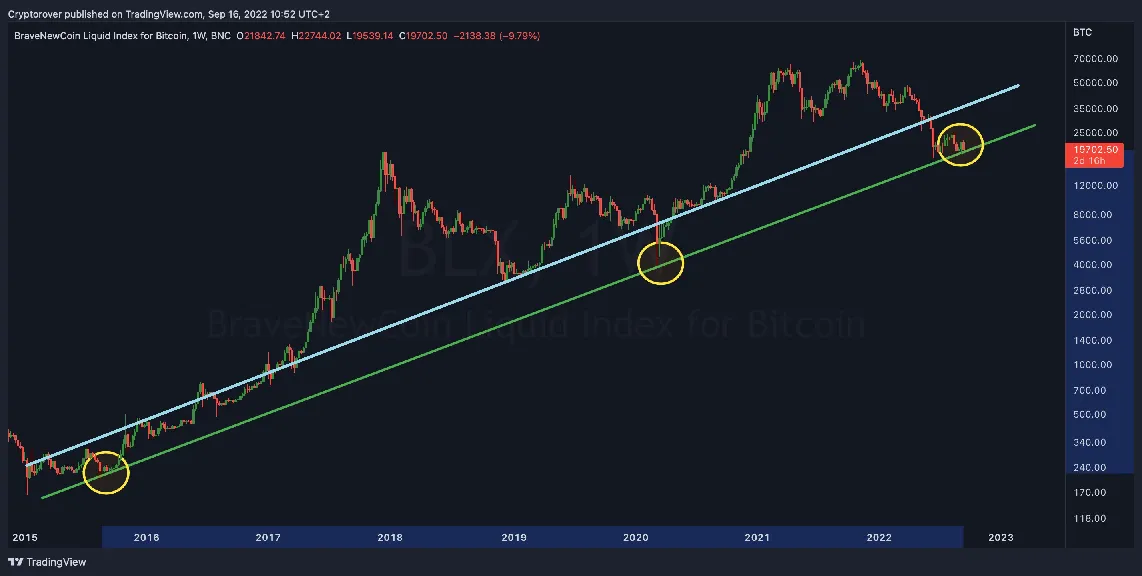
This light-blue line is the one that I usually draw.
While we are inside a legacy bear market, I think we have to assume that this line has flipped into a hardcore resistance line rather than the hardcore support line that it used to be. I expect it will eventually flip support again, but we have to get out of the recession that hasn't even officially started yet (especially according to the Biden Administration).
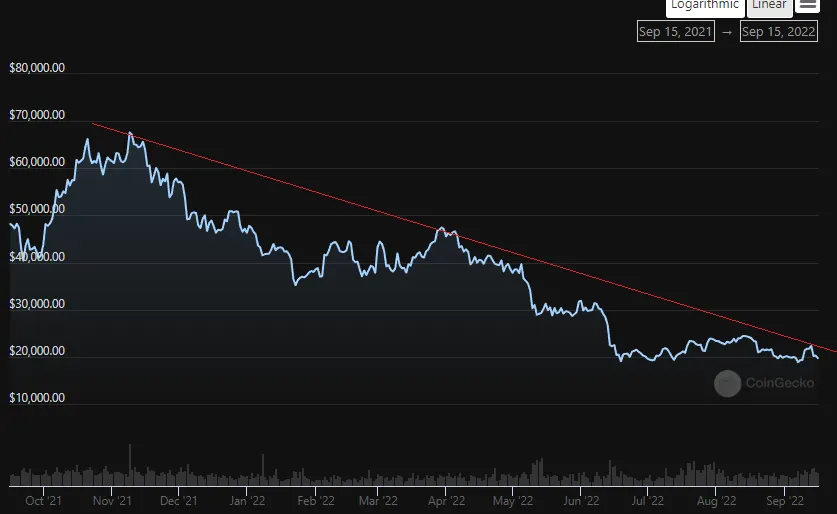
This is the current macro resistance.
As we can see, it's only going to take like two weeks for this resistance line to hit $20k. I think when that happens, we get an immediate pump to $25k, and I will declare the bear market officially over just like I did on April 2, 2019. Called it exactly.
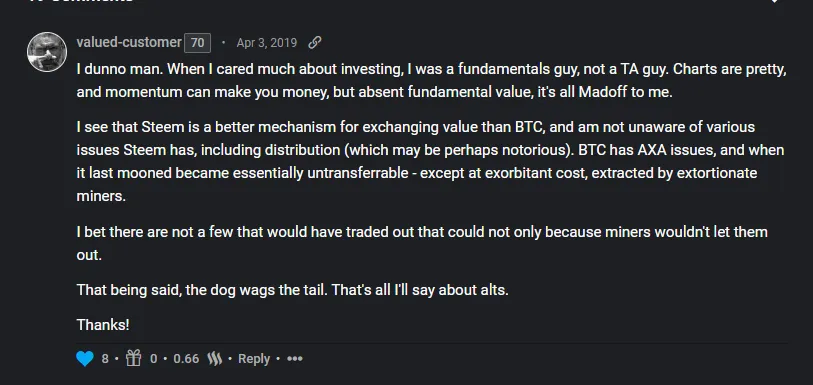
Hey @valued-customer, remember this?
Check it out I made a good guess once!
Man we've been at this for so long.
Crazy stuff.
Again, the macro resistance line is narrowing very quickly.
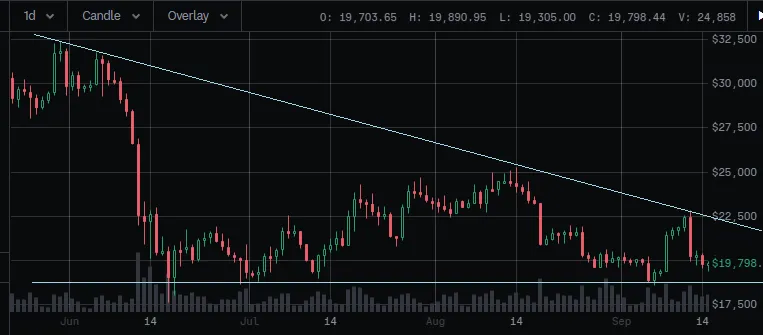
We are still firmly within the descending triangle, and I can't remember the last time a descending triangle like this with Bitcoin didn't breakout to the upside. All of the signs point to an overwhelmingly bullish position, especially considering how bearish everyone else is right now this second.
It's also quite noteworthy how long Bitcoin has been trading right below the $20k line. People HATE that. It's so demoralizing. It just crushes the unit-bias of a $20k price and makes people feel like the market is weak even though they might think exactly the opposite if it was trading 1% higher than it is now. I feel like this is just another classic case of the psychological manipulations that occur in the day-trading game. Weak hands are capitulating one last time before the run up out of this damn triangle.
Inverse Woo!
I've never seen this guy make a good call when I needed him to.
Never.
Again, I want to take the over on this one.
Am I actually placing a bet this time?
Yep! I've selected a new DEGEN coin, and that coin is RUNE. Rune is the best because it pumps twice and it dumps twice. That's because the deep liquidity pools of rune are often connected to non-stable coins. If the price of BTC goes down, RUNE automatically goes down because rune is paired to btc in a deep RUNE/BTC pairing. Then if Rune gets dumped again on top of that (almost always the case) it crashes again. Sounds bad until we realize that it does exactly the opposite to the upside. If this is the bottom RUNE is going to pump faster than the other tokens I hold. Gamble gamble.
And yeah sure I make a lot of speculative posts and I'm wrong a lot, but I hardly ever bet on them. I'm betting on this one. It's for realz this time. Let it ride.
Guess what else I'm betting on?

LOL 1M
I have ONE MILLION CUB in the kingdom right now. It's not for sale boys. Look elsewhere. Like I said in an earlier post, CUB is burning all the inflation it prints with the wrapping fees, and color me impressed. 2 cents has been holding strong, and even more importantly the health of the DEN dominance has increased. Used to be that 70% of all CUB was in the Kingdom. It's since dropped to 50%, which makes me much less nervous about further dumps. Time to go full Diamond Hands.
It's also worth noting that the April 2, 2019 post where I declared victory over the bear market... all the picture links are broken. Want to know why? I was posting on Busy.org. Remember Busy? Was a frontend for Steem that doesn't even exist anymore. We've been in this game a long time, and our community is on the way up no matter what the legacy economy says.
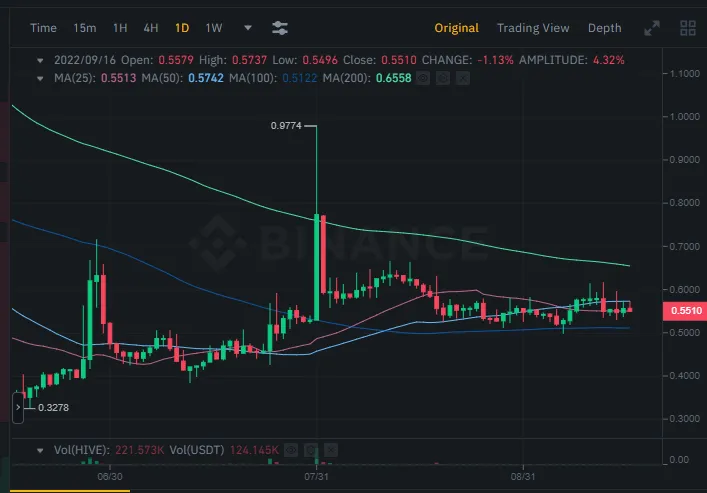
Hive has been proving quite handily over and over again that it is largely decoupled from the greater market, and that's very bullish in my opinion. We see that the spot-price is constantly traded based off our own moving average, which is interesting.
We can see now that the MA(25) is a light support and MA(50) is acting as light resistance. We'd like a golden cross there. In fact, with the MA(200) above everything, we need all the lines to move above the green one on the top to enter the crazy phase of golden crosses.
MA(100) is more of the hardcore support at 51 cents.
I'd buy more Hive there.
MA(200) is pretty heavy resistance at 65 cents. However, at the same time, I still value this coin at 80 cents, so I think it's bullish that the MA(200) has gotten so low. I don't think it will be that difficult to retake 80 cents and initiate another round of golden crosses.
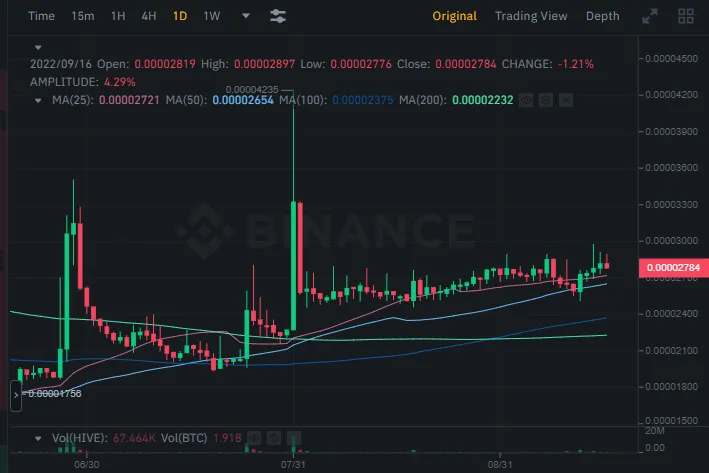
I feel like the HIVE/BTC chart is less relevant for TA, but it looks incredible right now. Spot price is still trading above every single moving average. Doesn't get more bullish than that. We got that dip recently from Bitcoin moving up and Hive trading flat, but once again that just shows how Hive is largely decoupled. It's hard to not be bullish on Hive when looking at a chart like this. In 2020 Bitcoin was $40k and Hive was trading at something ridiculous like 300 sats per Hive. Now BTC is $20k and we are trading at 2800 sats? Wild. Such progress.
It will be interesting to see what happens when the next hardfork goes through. Last I checked the tentative date was October 10th or 11th after several pushbacks. Obviously no fundamental gains will be made the day we fork (and sell the news price action is possible), but still we are adding a bunch of very important features. 3 second block irreversibility is going to be a very good upgrade on a technical level. So is the ability to archive and/or compress old blocks that are just sitting around hardly getting accessed. Resource credit delegations (not sure when this happens) are also clutch. Hive devs are killin it.
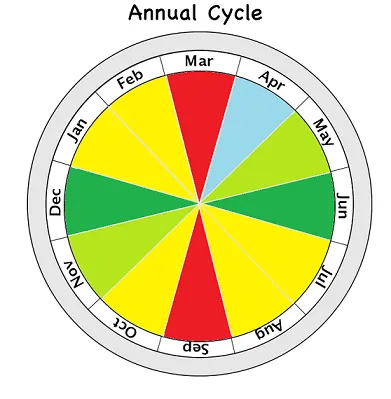
Will the cycle chart finally not betray me?
A broken clock is right twice a day, amirite?
Regardless of the recent history, September is always a slow month for the world economy. Summer is over. Kids are going back to school. Vacations and such leave families cash-poor for a few months. Yada yada yada.
Also, with all the overstock in the warehouses I'm still predicting that sales at the end of this year are going to be insane. That very well may be a time of big spending before the gloom and doom of this economy actually catch up to us.
Best case scenario:
What I'm hoping for is that from here, we move up to the higher trendline by the end of the year. That's $45k-$50k Bitcoin in November or December (probably December). Then a pretty demoralizing crash to follow, perhaps even back to the lower trendline, which would be around $25k-$30k at that time, depending how long it takes for the market to deflate.
Conclusion
It's weird to be bullish like this at the most awkward time ever, but it is what it is. I say that all the bad news is already priced in and the market will pump when the FED announces their rate increase in four days.
What can I say, I'm a perma bull. Sentiment can shift at the drop of a dime in crypto. Today everyone is trying to say we are going to see $12k-$15k, but that all melts away if we pumped to $25k in a couple weeks like I'm predicting. The market is fickle, and so are the players within it.
Ultimately I just really wanted to get this prediction out there because if I'm right, that's two macro bear cycles I predicted with great accuracy... using the most basic-bitch straight lines on a screenshot makeshift chart. We might be overthinking all this if I end up being correct again. Cheers!