If you haven’t notice by now Splinterlands is kinda going viral and its impacting everything on the blockchain. One of those metrics is the number of active accounts.
Let’s take a look!

Top Four Hive Operations
We will be looking at the activity on the chain by the top operations made:
- Post and comment
- Vote/Curate
- Transfer coins
- Make Custom JSON transactions
Apart from the above, reading, or page views, is also a crucial part of this ecosystem, but this type of operation is not stored on the blockchain. There is some general traffic websites that can be used for this, like https://hypestat.com/.
We will be looking at the number of active accounts by the operations stated above for the period from April 2020 to July 2021. Hive was created at the end of March, so this period will cover the activities in its exitance.
We will be looking at the number of DAU (daily active users) and the number of MAU (monthly active users).
Number of Accounts that Posts or Comment
First let’s take a look at the number of accounts that are posting on the blockchain, as one of the core operations.
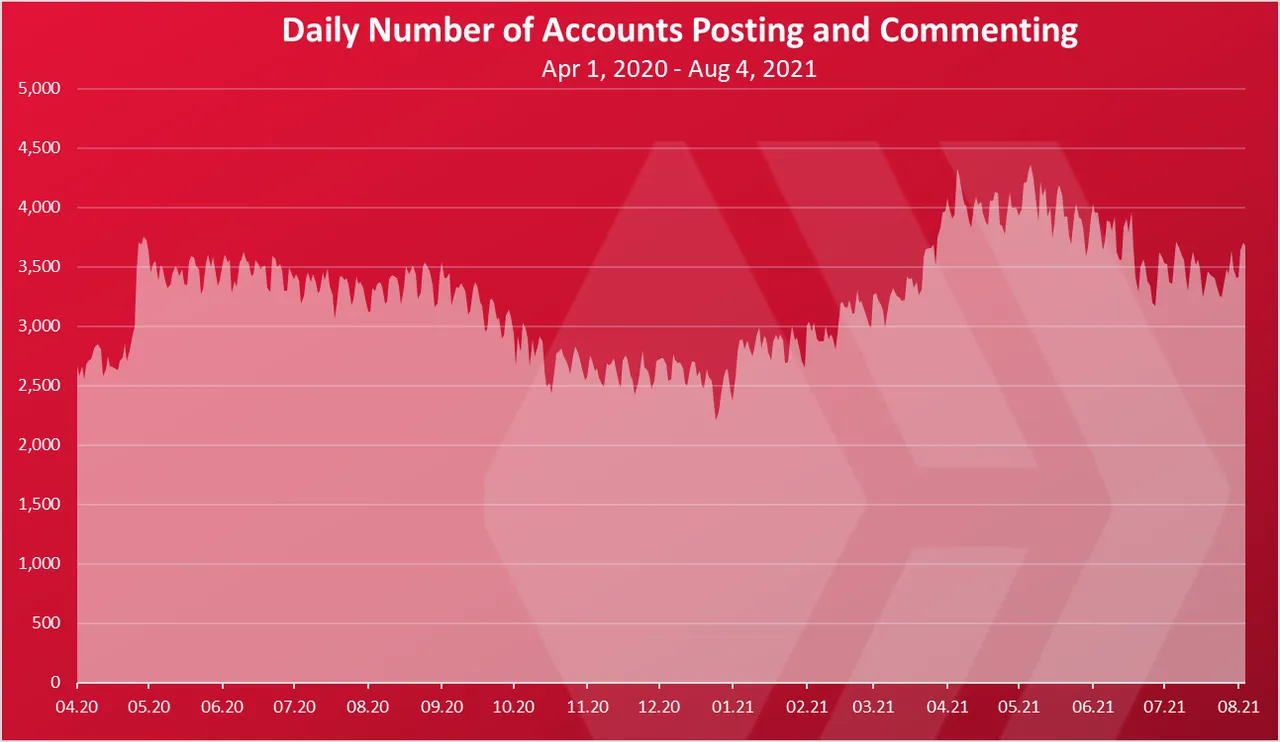
The above is the chart for DAU, for accounts making posts or comments on the blockchain.
An increase at first, as the price went up, then a drop and an increase again towards May 2021. Then a drop again.
The chart for the active posting accounts is following the price actions closely. Price goes up, more people post and the opposite. In the last week we have an increase again. Around 3.5k daily active accounts that post or comment.
Later we see the MAU stats for the accounts that are posting and commenting.
Number of Account that Vote/Curate
How about then number of accounts that vote. What is their number? After all the voting feature on the blockchain is at its core. Rewards are distributed via votes.
Here is the chart.
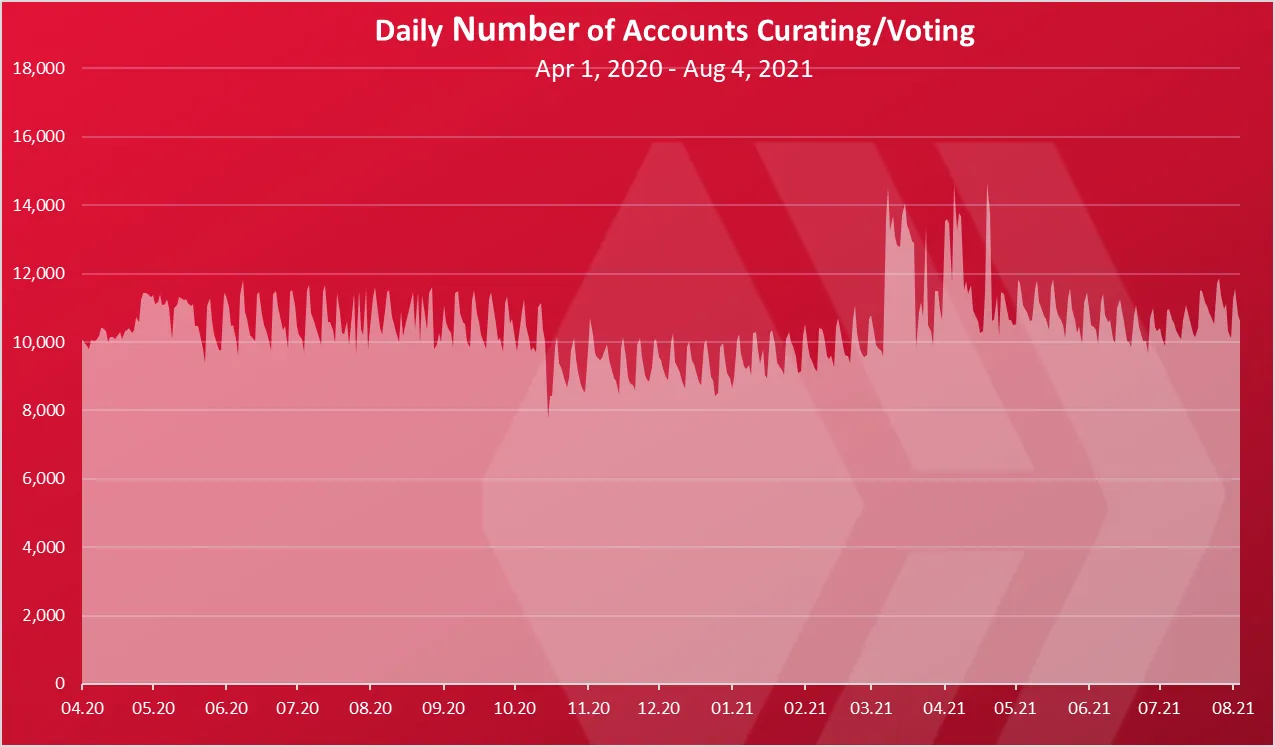
Quite a steady pattern here.
The number of unique daily accounts that vote is higher than the number of accounts that post or comment. Since the creation of the blockchain its almost constant between 10k and 12k per day.
Not sure what the zig zag pattern is 😊.
Number of Accounts That are Making Transfers
What about the basic crypto activity? Transferring value. How many users are making daily transactions? Here is the chart.
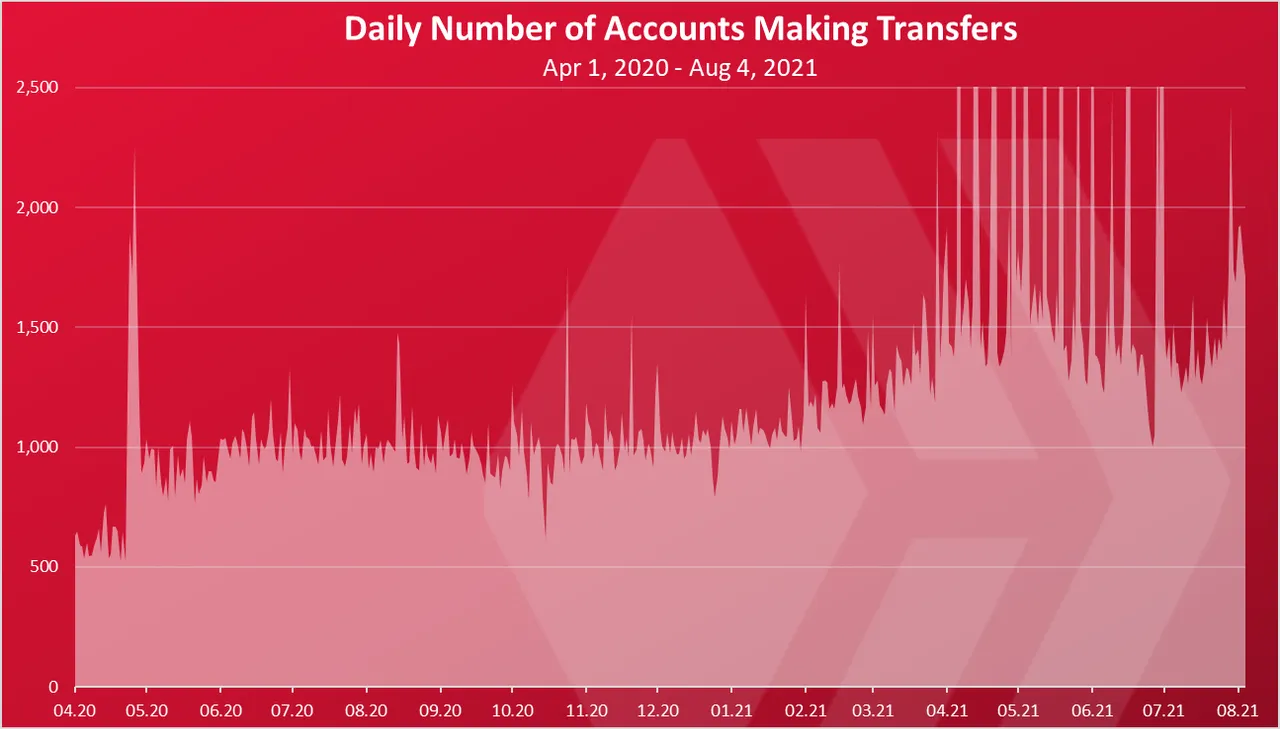
The number of accounts making transfers started with around 600, then it spiked, along with the price spike at the time. Afterwards it has been around 1000 accounts per day.
In the last period it is around 1500 accounts making transfers per day with some large spikes.
Number of Accounts That are Making Custom JSON Operations
Now let’s take a look at the mains suspect. The custom json transactions!
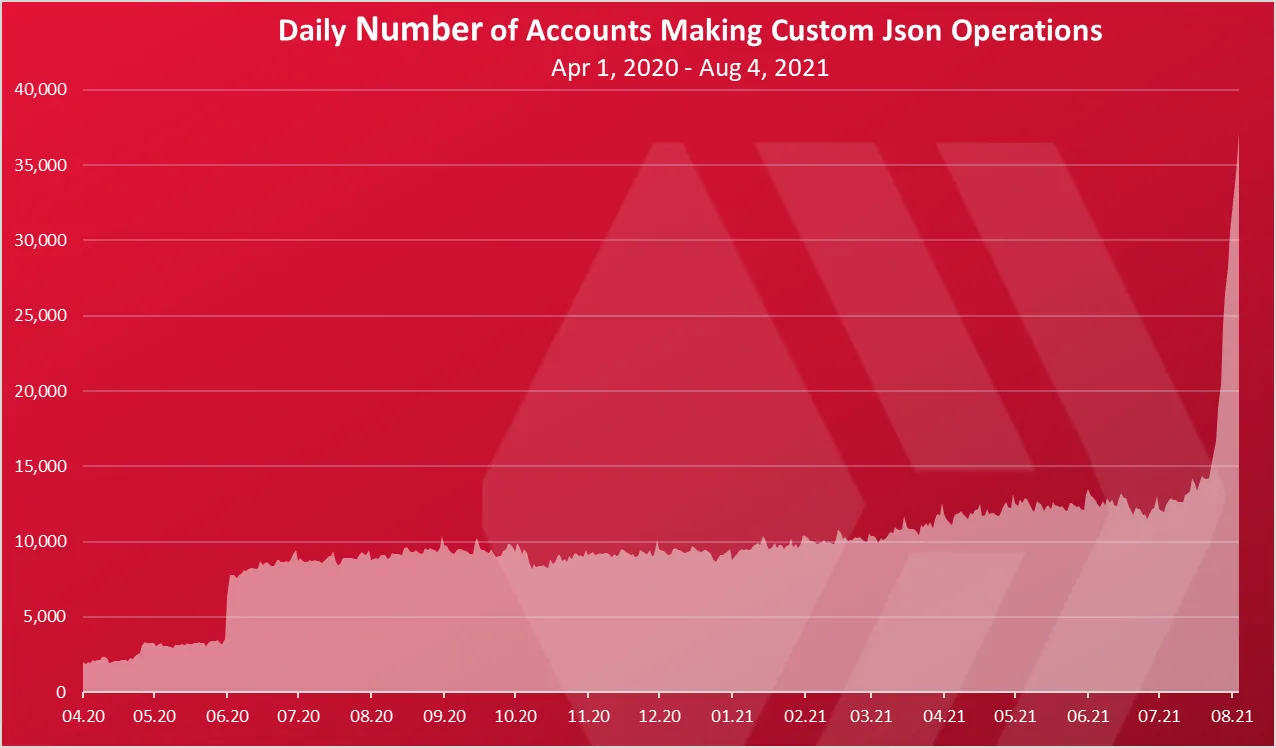
As expected, there is a huge spike in the number of accounts making custom json transactions per day. The number is going for 40k active accounts per day. Previously this number was around 10k for a long period with some steady growth in the last few months, and an absolute explosion in the last week.
Will see how high this will go.
Monthly Active Accounts By Type Of Operation
What about monthly active accounts? Not everyone is making daily activities. Monthly active accounts can be a more accurate representation. Here is the chart for MAUs by category.
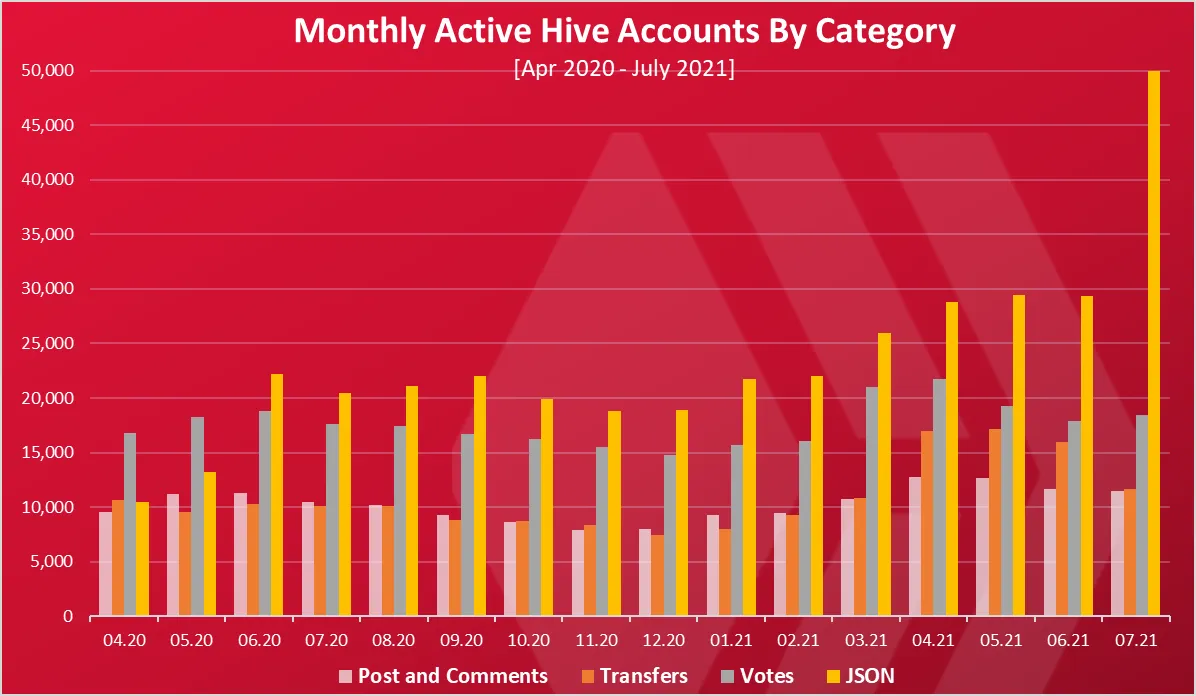
These numbers are for the top 4 activities described above.
A note that these are MAUs per category, the total number is higher than the above.
Number of accounts posting, voting and transfers are all following a similar pattern with smooth up and downs in the months, depending mostly on the price. Then we have the accounts making custom json transactions that have been growing for most of the period and have doubled in July. Just a note that the growth of Splinterlands started at the end of July and August will most likely see a higher highs then July.
There was 50k active accounts making custom json transactions in July 2021. Account posting was around 11k, similar for accounts transferring tokens, and the number of accounts curating is around 18k.
In total the Hive blockchain has more than 50k MAUs in July 2021, probably somewhere between 60k to 70k. The number is doubled from the previous one, where it was around 30k.
When we compare the number of active accounts per type of operation in the last month, we have this.
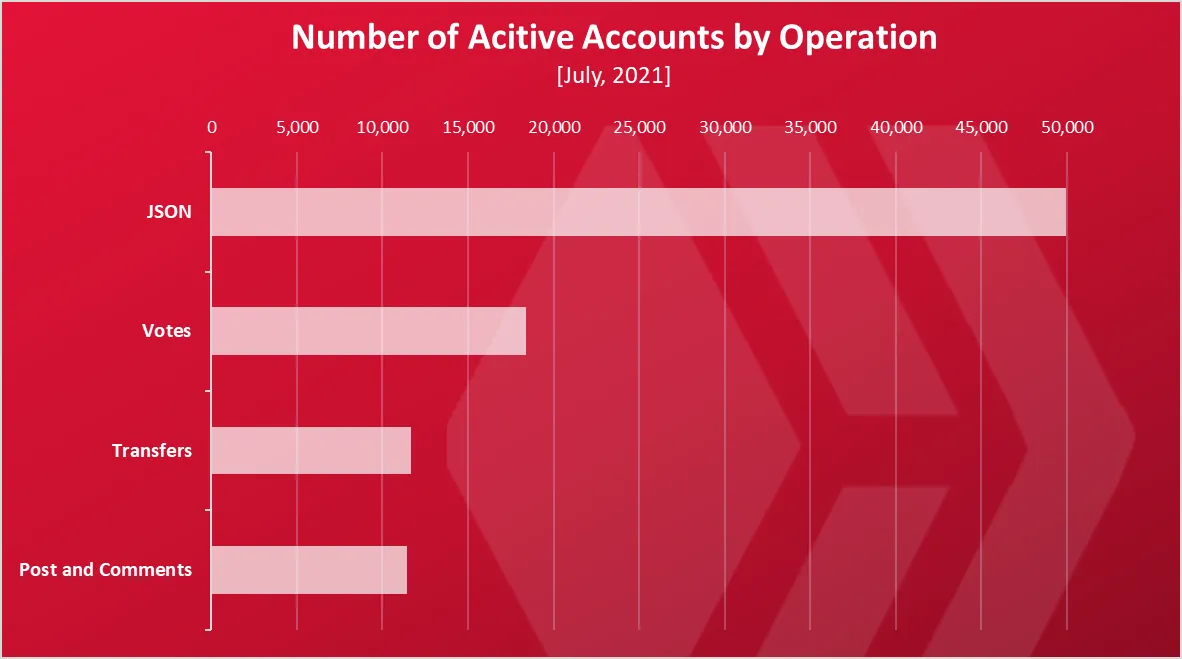
The accounts making custom json transactions are dominant now, with 50k, followed by the curators, then transfers and posts.
Readers
Since the main dApp build on the Hive blockchain is a blogging platform the obvious question is how many readers it has. The numbers presented above are about authors, curators, gamers, etc… users that actually interact with the blockchain with some action.
The number of readers is not stored on the blockchain. The interesting thing is that there is more than one frontend to the blockchain, no there is no one single point of entrance to count.
According to https://hypestat.com/ the numbers for unique daily visitors at the moment are:
- hive.blog 152k
- Peakd.com 118k
- Ecency.com 79k
- LeoFinance has 47k
The other interfaces and tribes have some more. Some of them may overlap but I would give a rough estimate somewhere around 300k overall daily visitors. Have in mind this is very rough estimate.
Readers are still the most numbered users on the chain :).
All the best
@dalz