How is the activity on the Hive blockchains doing? Now when Splinterlands has its massive growth!
We will be looking in the numbers for activity, and not just in terms of posting but other activities as well, like votes and custom JSONs that are mainly driven by games.

Before we continue with the analysis just a note on the activities. Unlike the good old Bitcoin, that has only one operation (transfer coins), Hive has a lot of them.
Usually when talked about activity on the Hive blockchain a lot of the users have in mind posting and commenting. Here we will be looking in the top 4 activities on the blockchain:
- Posts
- Comments
- Votes
- Transfers
- Custom JSON operations
The above consist the majority of all the activities on the blockchain. The claim rewards operation also has a high number of activity, but we will leave out that one.
The period that we will be looking at here is June 2020 to September 2021.
Lets take a look.
Number of Posts and Comments
Although gaming is growing on the blockchain, bloging still remains the core activity and one of the key ways inflation is distributed. Users can blog about gaming as well 😊.
Here is the chart for the number of posts and comments on the Hive blockchain.
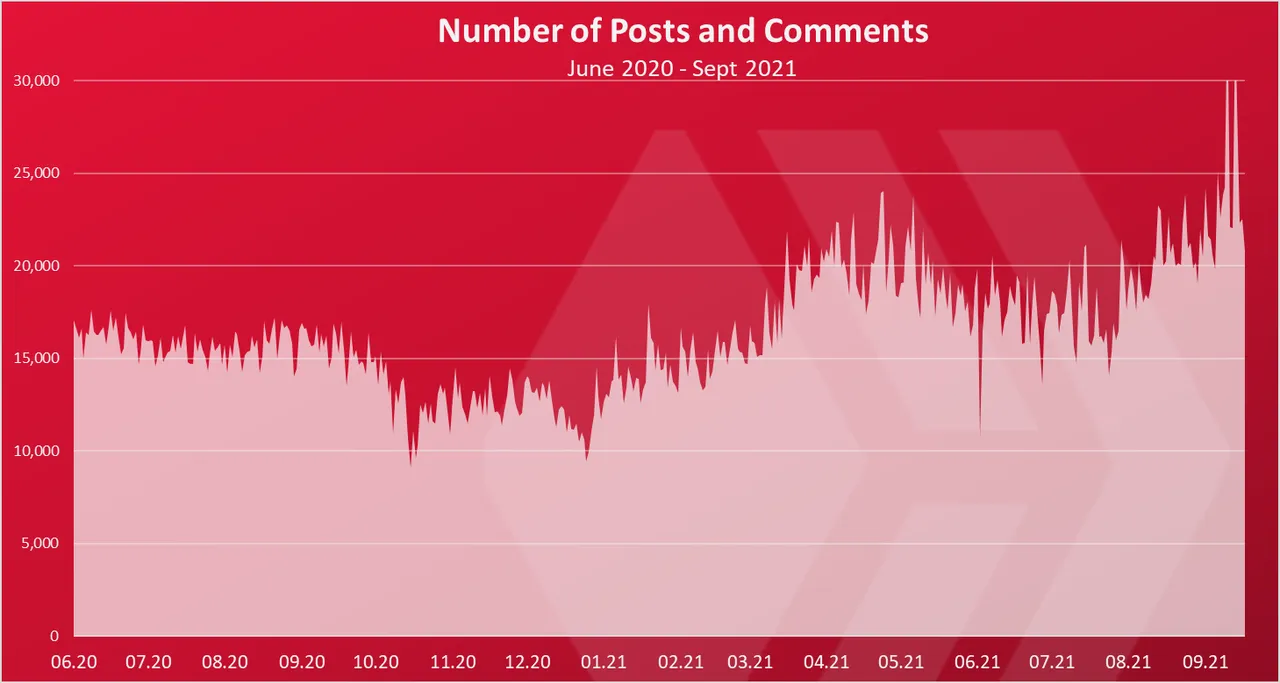
We can see that in June and during the summer 2020, the number of posts and comments was quite stable, around the 15k per day, then it dropped a bit in the period October to December. Starting from January the posting went up, reaching almost 25k post and comments per day in May 2021. Then a drop.
In the last month we have an increase in the activity for post and comments with some odd spikes, but still an overall up trend, that is representing an ATH for posts and comments.
The numbers of posts and comments follow the price a lot. They peaked in the start of May 2021, the same as the price, and then as the crypto correction followed so does the numbers of posts and comments. Now we have an increase in the price and the activity follows.
On few occasinos we have seen a 30k posts and comments per day, while the average is around 25k in the last period.
Number of Votes
The chart for the votes looks like this.
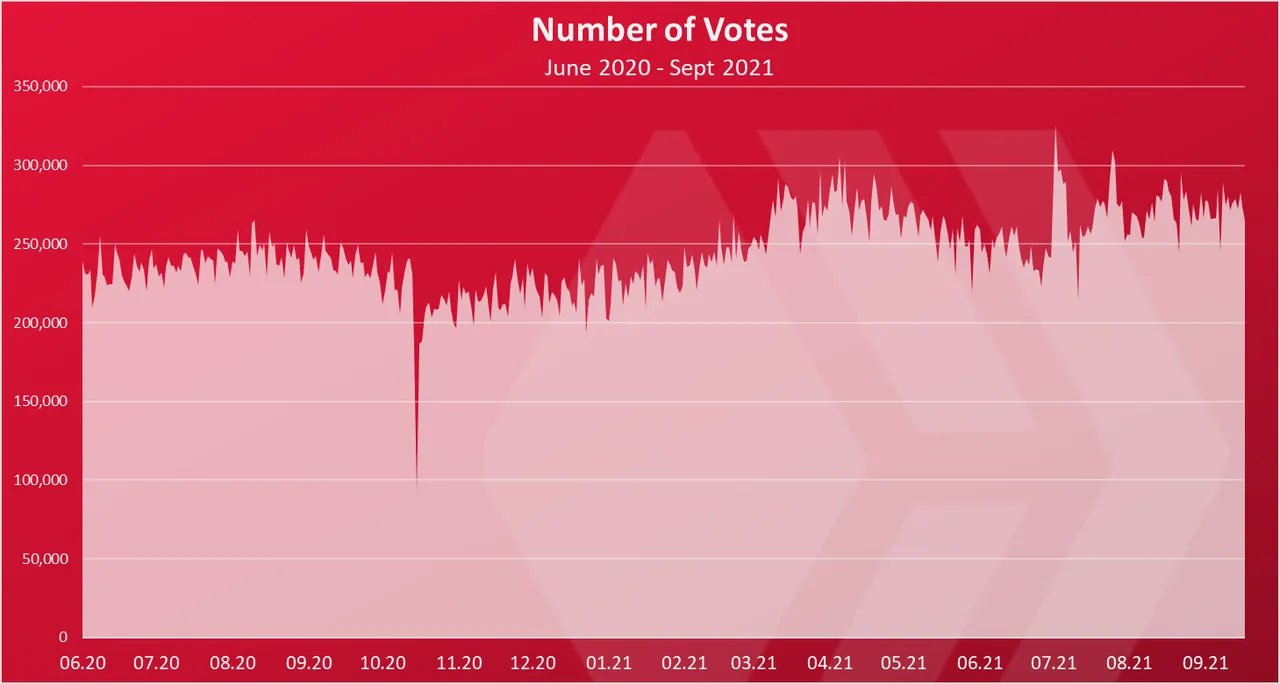
Votes are one of the core operations on the Hive blockchain. That is how the rewards are distributed. The Proof Of Brain mechanism (PoB) 😊.
The number of votes has been quite steady in the period, compared to the price volatility.
In the last period there is around 270k votes per day. On few occasions there was 300k per day, but this number is yet to be reached on regular basis.
Number of Transfers
The chart for the transactions looks like this.
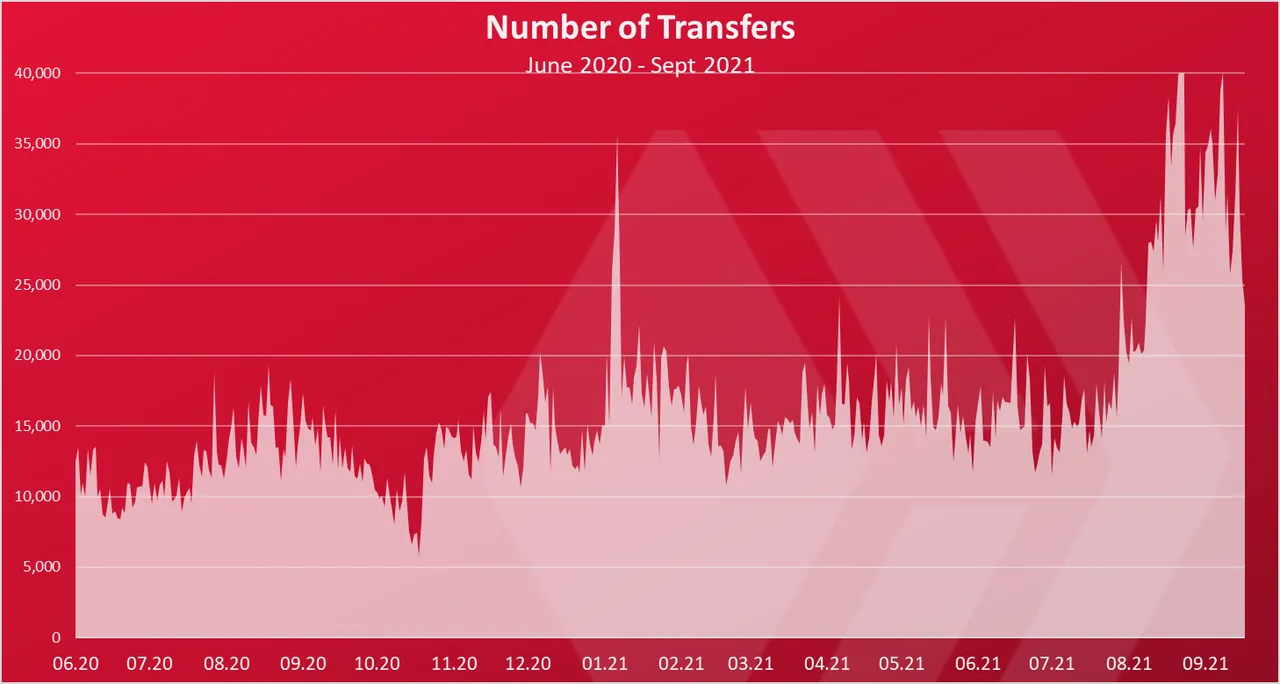
Transfers have increased significantly in the last period. Going up from around 15k to 40k per day. This represents the overall activity for moving value on the blockchain. Again here Splinterlands is having a great impact, but probably the HIVE to HBD conversions as well and all the arbitrage that is happening
Number of Custom JSONs operations
The chart for custom JSONs operations.
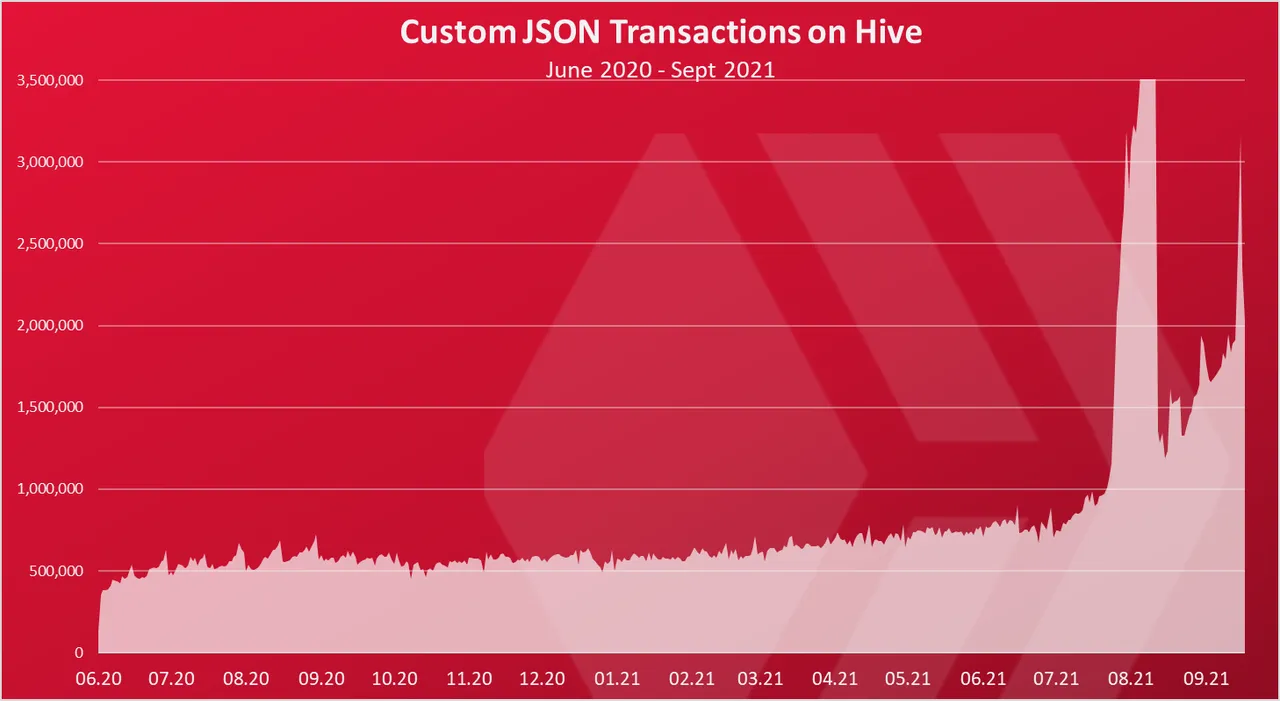
The custom json transactions are used mainly from the games on Hive, with Splinterlands on the top. Custom jsons are just a text files, but unlike the post and comments, they are like sidenotes, and don’t appear as post.
This chart shows the growth of Splinterlands the most.
It is an interesting one, cause we can see the spike that happened in August, pushing the number of operations to more than 4M per day, and then a drop to 2M.
This is because Splinterlands has adjusted the way they store data on the blockchain, especially for the battles, and now not all of it stored on the blockchain, resulting in less transactions. The numbers are still high with around 2M tx per day, compared to the around 500k before.
Overall Activity on Hive
Well not quite overall but most of it 😊.
When we combine all the charts above, we get this.
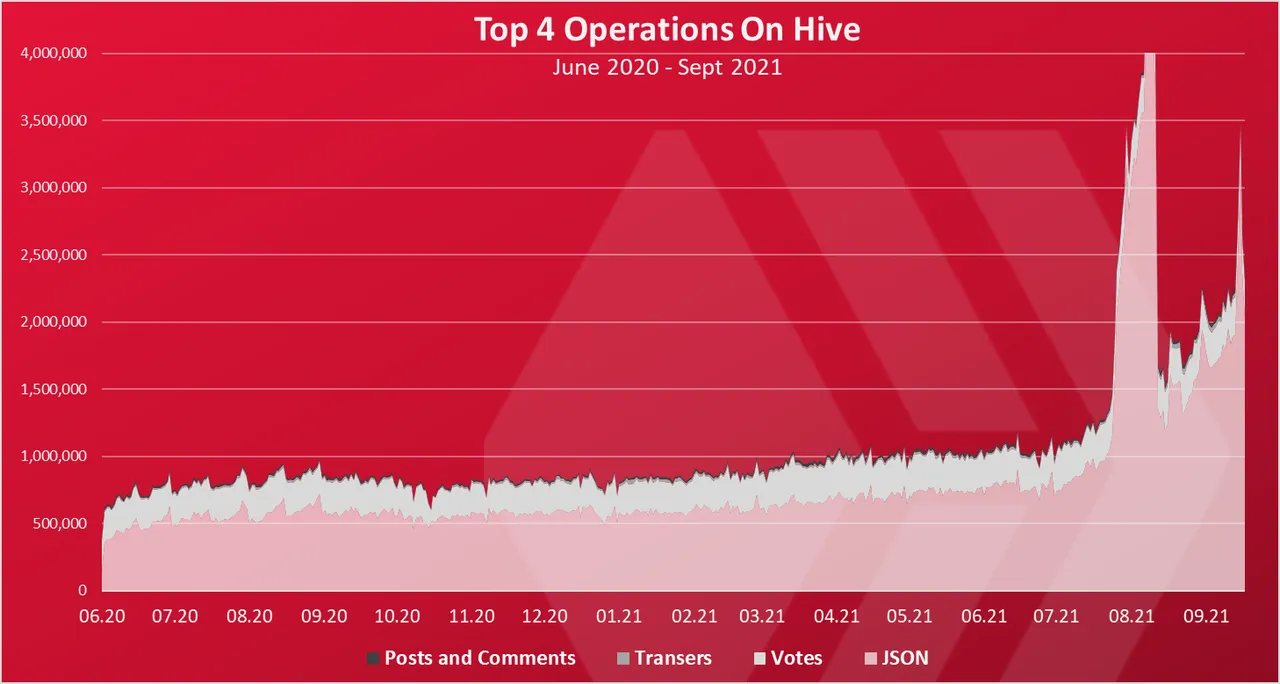
As we can see the custom jsons operation are now dominating the Hive blockchain. In the last period more than 80% of all the operations on the Hive blockchain are custom jsons.
Although we should mention that the “weight” of these operations is not the same, so its not totally comparable. Posts have the largest weight, as they require a lot of texts and effort, unlike votes or jsons, that are usually a one click operation.
Number Of Transactions Per Month
The monthly chart presents a better overview of the transactions. Here it is.
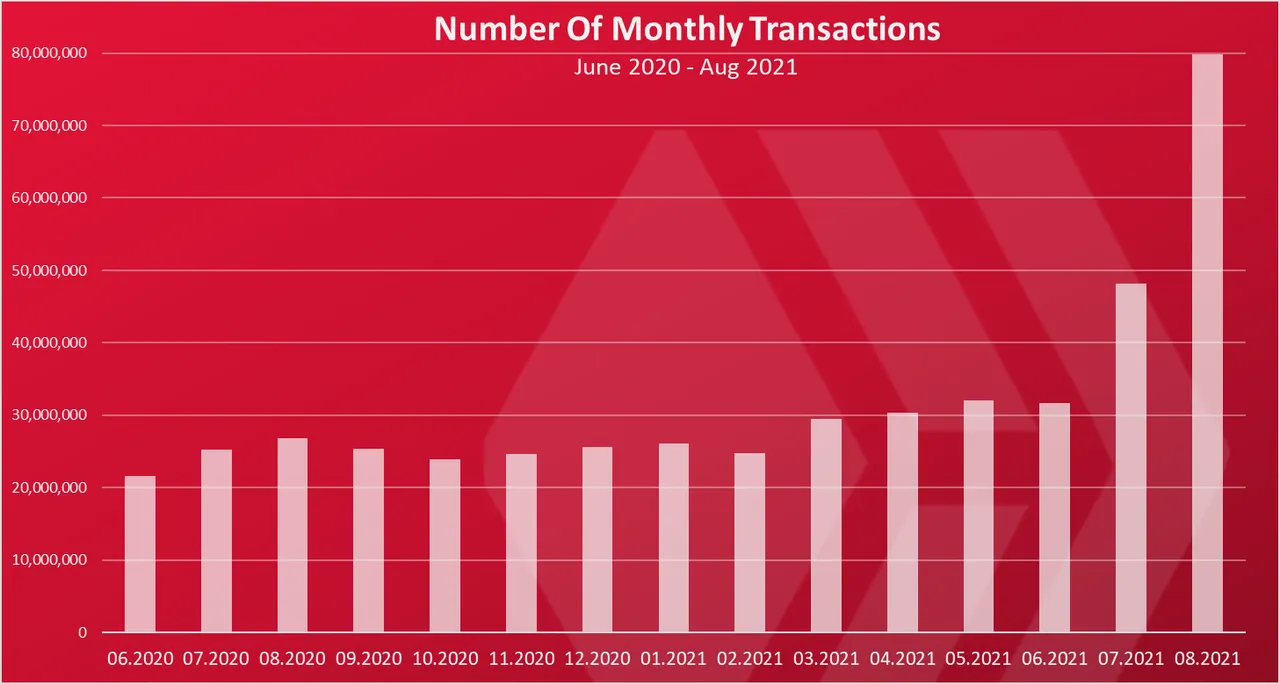
Up until June 2021, the number of transactions per month was around 30M. Then in July it went to almost 50M and in August 2021 to 80M transactions per month. For comparison BTC has around 8M to 10M monthly transactions and ETH is around 30M to 40M. BSC is somewhere around 150M to 200M.
With the number of transactions as the above, Hive is proving that it is efficient and can handle the load.
All the best
@dalz