Aave is one of the few defi protocols that has proven itself throughout the years. The market went up and down, but the protocol kept on going. The TVL even under these bad conditions is still in the billions. No hacks and failures on the platform up to date.
It is now by far the number one borrow and lending protocol. Borrowing and lending for the new defi age.
Let’s take a look.
Aave works in simple way at first sight. Users deposit (supply) collateral in some of the tokens that are accepted on the platform and borrow against that collateral, another assets/tokens that are listed.
A classic example would be deposit BTC as collateral, borrow some stablecoin, as example USDT.
The main thing to look out for is the health factor or the supply to borrow ratio and avoid liquidation. By design the protocol have limits and it wont allow you to borrow more than 70% of the value of the assets you have supplied. But this being crypto you want to be much safer than that and go in the range of 10% to 30% loan to collateral value. This means a 10k collateral for 1k to 3k loan. Managing this ratio is at the end of the day an individual decision, but just have in mind the overall rules.
More to read on Aave on the docs link.
Here we will be looking at:
- Total value locked
- Deposits volume
- Defi protocols rank by TVL
- Number of users DAUs
- Top Pairs
- V2 VS V3 Volume
- Price
The data here is compiled from different sources like DefiLama, Dune Analytics and Messari.
Total Value Locked
Here is the chart for the TVL on AAVE.
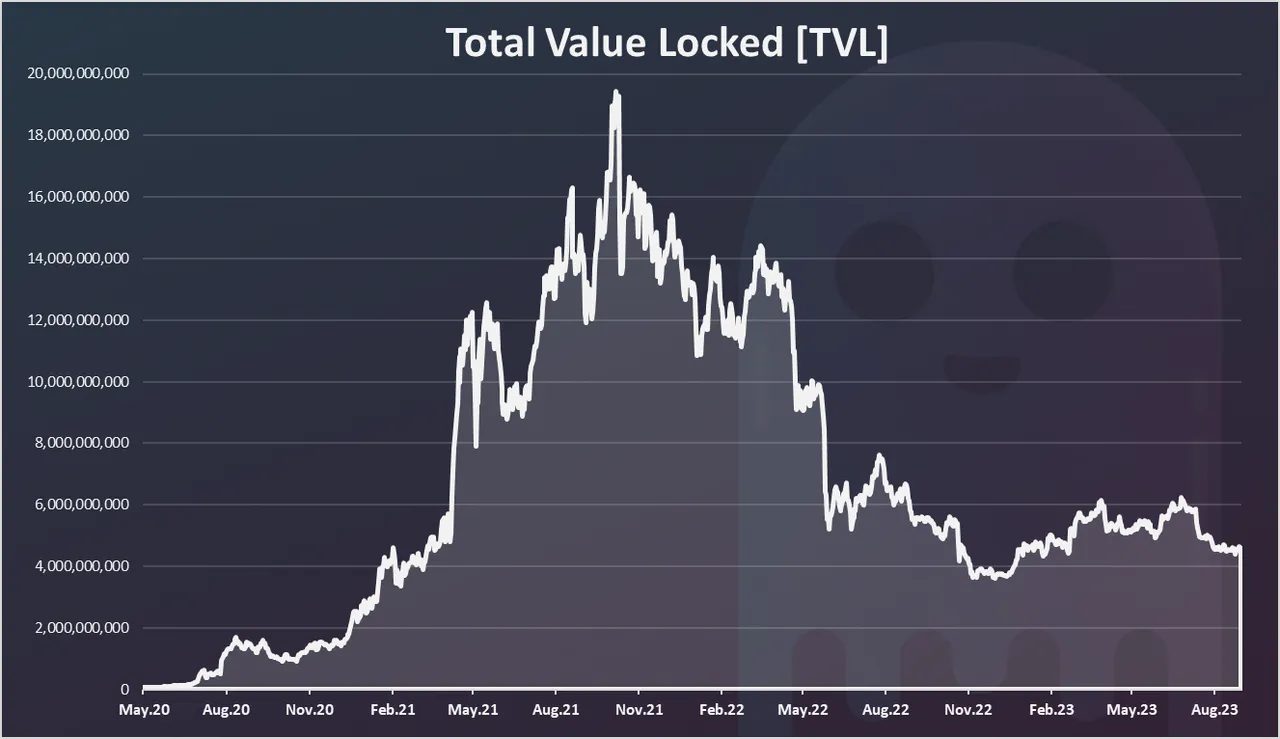
This chart goes back from the protocol beginning back in 2020, through the bull market of 2021 and up to date.
We can notice the sharp increase in the TVL in 2021, reaching almost 20B in the summer of 2021. Then a drop to around 12B and a further drop in 2022 to a record low of 4B. We are now around 5B in TVL on Aave, and it has been hovering around that mark for more than a year now.
We can say it has stabilized itself around 5B TVL.
Deposits Volume
Unlike the swaps and trading platforms, there is no active trading on Aave, but still there are deposits, borrows, liquidations etc. Here we will be looking at the deposits as there is where the most volume is.
The chart looks like this.
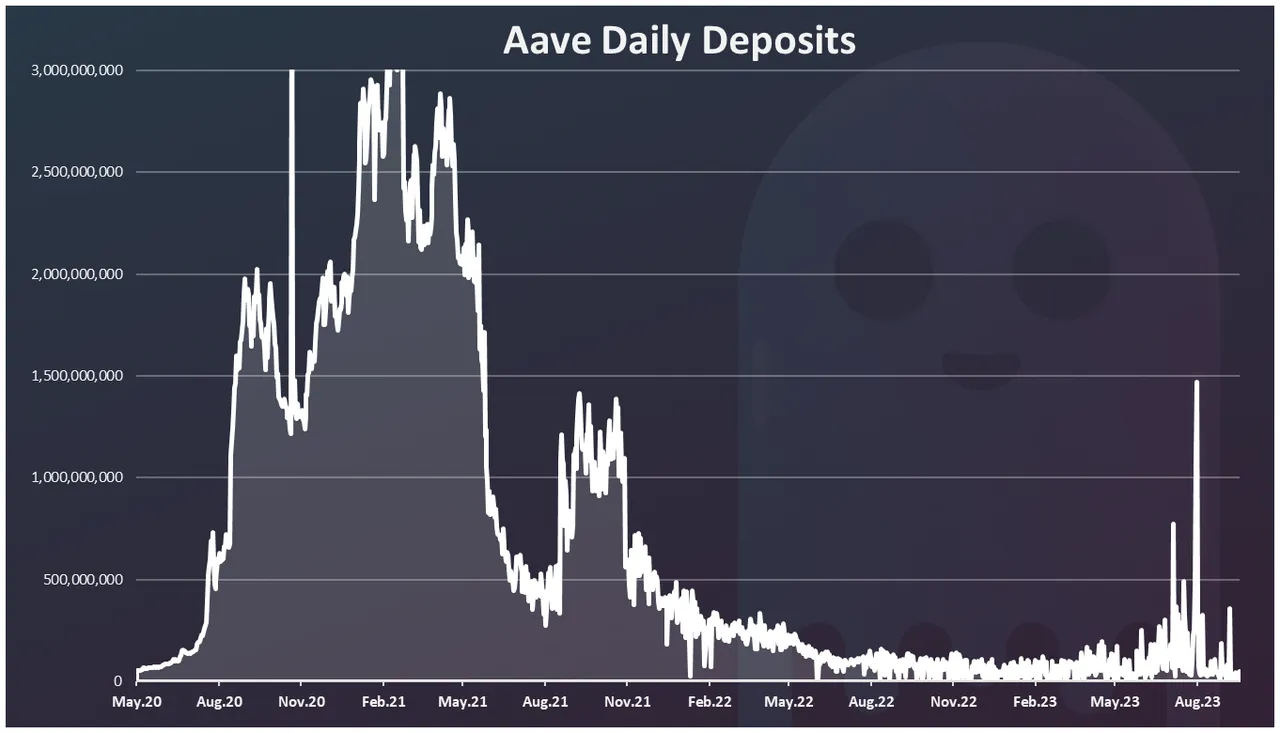
This is even more volatile than the TVL. Interesting there were a lot of deposits starting from 2020, earlier than the bull market in 2021. This is probably due to the fact that Aave was a new protocol then and it was basically starting from zero TVL.
After the initial boom in deposits there was a drop in 2021, then an increase again in August 2021, and later a further drop in the deposits. There was a spike recently in August 2023 as well.
In 2023 the deposits volume is on average around 100M per day.
Top Defi Protocols Ranked by TVL
How is the Aave protocol doing when compared to the other ones? The total value locked is usually one of the metrics these protocols use.
Here is the chart.
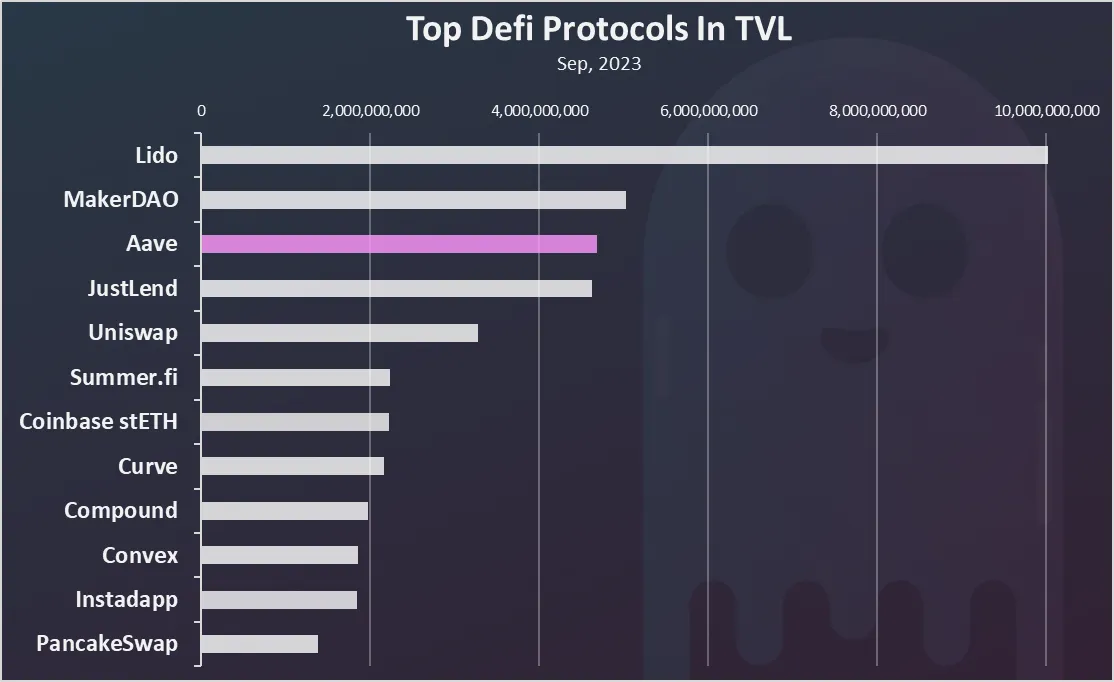
Aave comes as no.3 protocol in terms of TVL!
The Lido protocol, that is the no.1 on the chart with 14B in TVL is a bit specific. It is used for ETH staking, and it has only staked ETH in it. MakerDAO on the second spot is used to generate the DAI stablecoin.
Aave is close to Maker, but also closely followed by the JustLend protocol.
The JustLend protocol is based on Tron and there are a lot of so to speak native tokens to Tron, that are most likely inflated. So, take the numbers on that one with reserve.
Top Supplied and Borrowed Assets on Aave
What are the assets that have the biggest supply on Aave?
Here is the chart.
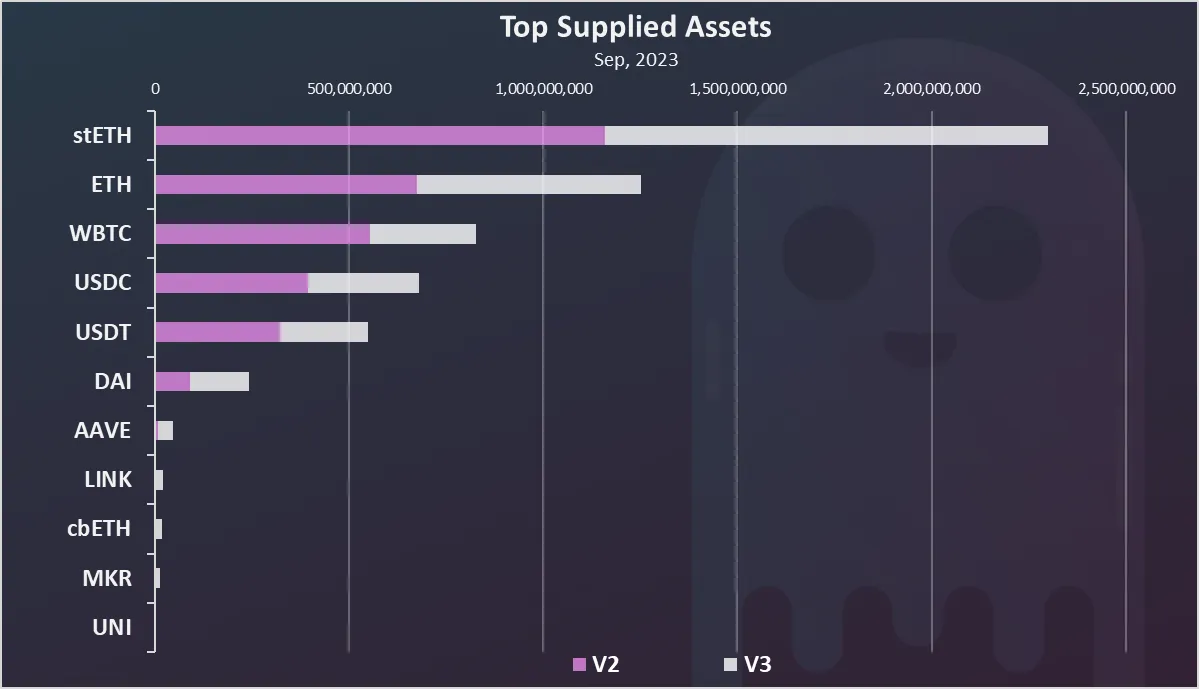
Aave has a V2 and V3 versions, and both are represented on the chart above.
As we can see Ethereum is the number one asset that is supplied on Aave, in both of his forms, liquid and staked. This is probably to a no surprise because Aave is native to Ethereum.
The wrapped version of Bitcoin on ETH comes next, followed by the stablecoins USDC, USDT and DAI.
What about the top assets that are borrowed?
Here is the chart.
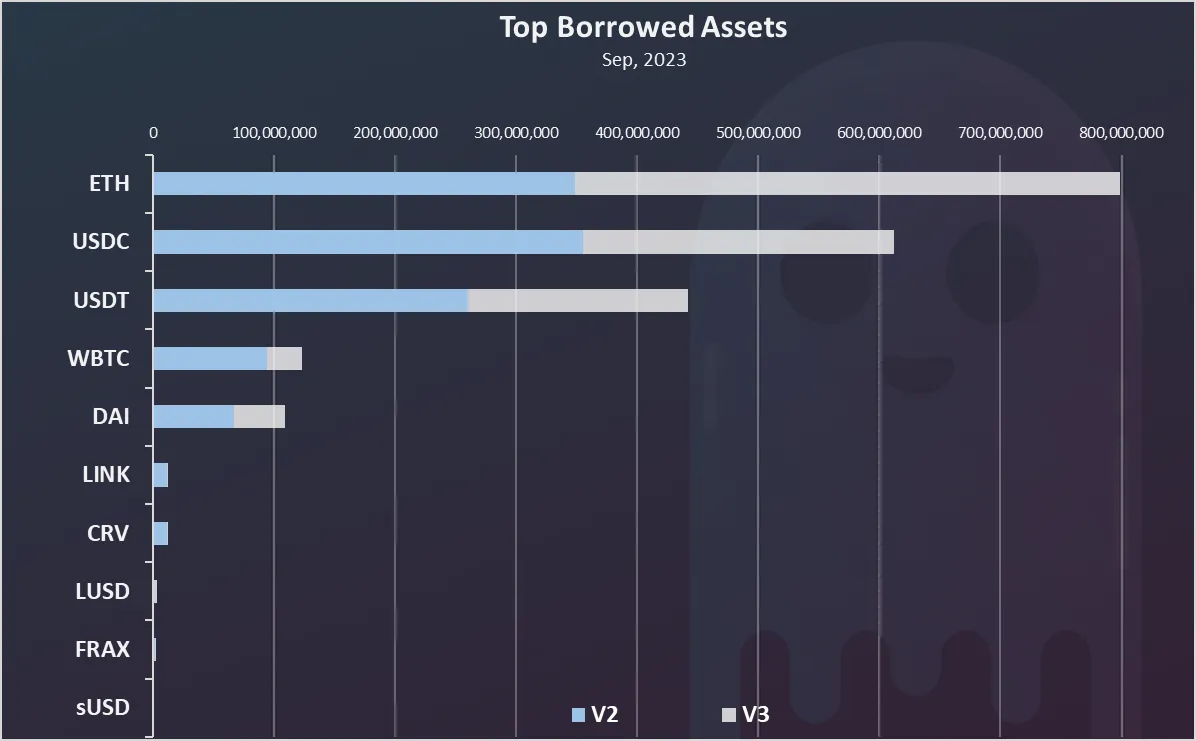
ETH comes on top here as well followed by USDC and the others stablecoins USDT and DAI. Bitcoin is also at the top. The other tokens have a very low usage.
We can notice that in general Bitcoin, Ethereum and the stablecoin are the most used tokens to supply and borrow.
The borrow to supply ratio for the different assets looks like this:
| Pair | Supply | Borrow | B/S |
|---|---|---|---|
| USDC | 680,000,000 | 612,000,000 | 90.00% |
| USDT | 550,000,000 | 442,000,000 | 80.36% |
| ETH | 1,252,000,000 | 782,000,000 | 62.46% |
| DAI | 243,000,000 | 109,000,000 | 44.86% |
| WBTC | 828,000,000 | 123,000,000 | 14.86% |
The most borrowed asset in relative terms are the stablecoins. USDC comes on top, followed by USDT. Thes two have a Borrow to Supply ratio of 90% and 80%. Meaning most of the provided liquidity is used.
Ethereum also has a relatively high used ratio of 62%, while Bitcoin is only at 15%.
Version 3 VS Version 2
You might have noticed the V2 and V3 signs in the top supplied and borrowed charts. This is because the protocol as for other products has updates, and when an update launches, the old version is not simply depreciated, but the two coexist, as nobody can destroy the smart contracts.
But in time users usually move liquidity by themselves, as the newer versions has better options and overall data.
The V3 version of Aave was launched at the beginning of 2023. Here how is the market share between V3 VS V2 at the moment.
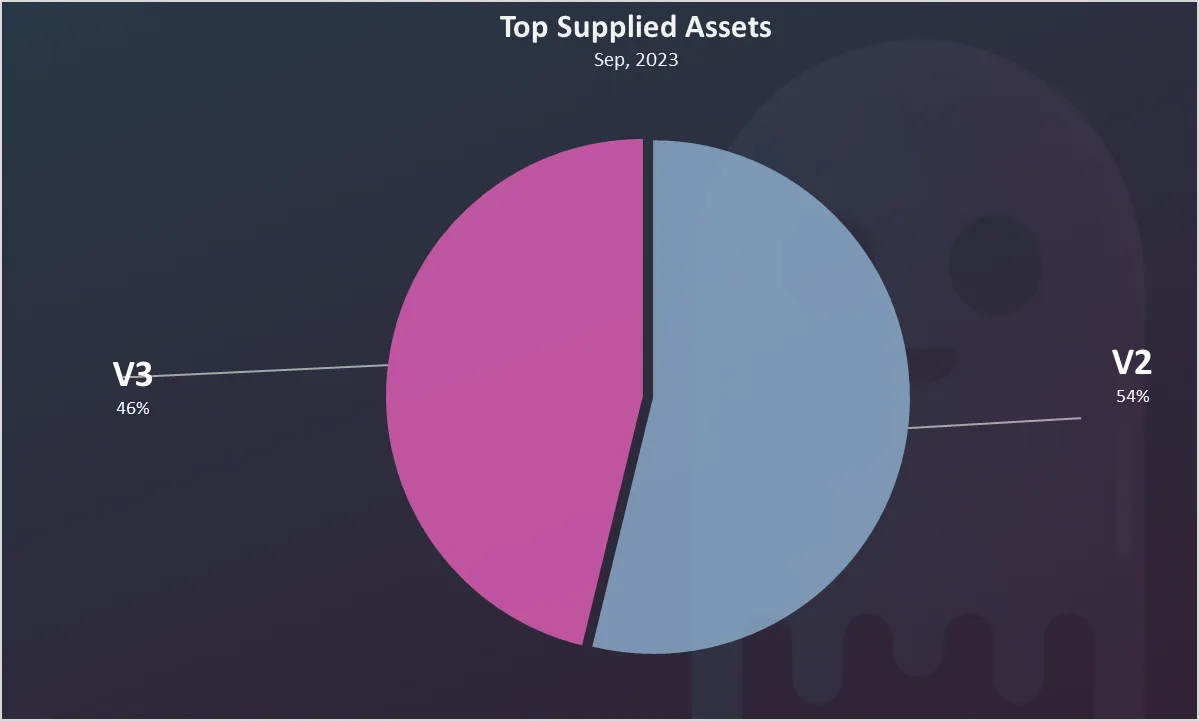
We can see that the liquidity is now almost split in half between the two versions, with the old V2 still leading by a small margin, holding a 54% share. But this will most likely go down as users slowly migrate towards V3. For example back in March 2023, the liquidity share of the V3 was under 10%, while now it has grown almost to 50%.
Active Users
How many users Aave has? Here is the chart.
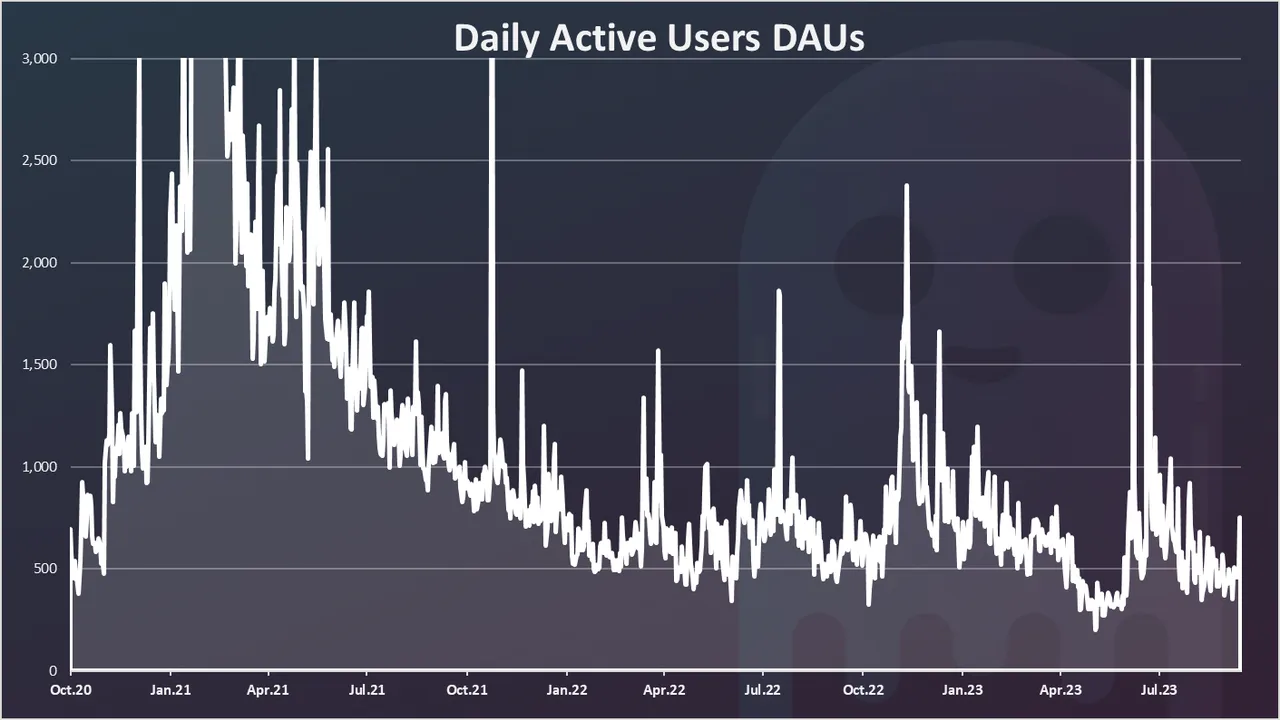
The top for active users on Aave was back in the beging of 2021. In the last period the number of active daily users is between 500 to 100. With a recent spike up to 3k.
This goes to show that most of Aave users play with larger amounts and don’t change their positions on a daily basis. It’s a long-term game when you borrow or lend.
Price
The all-time chart for the AAVE price looks like this.
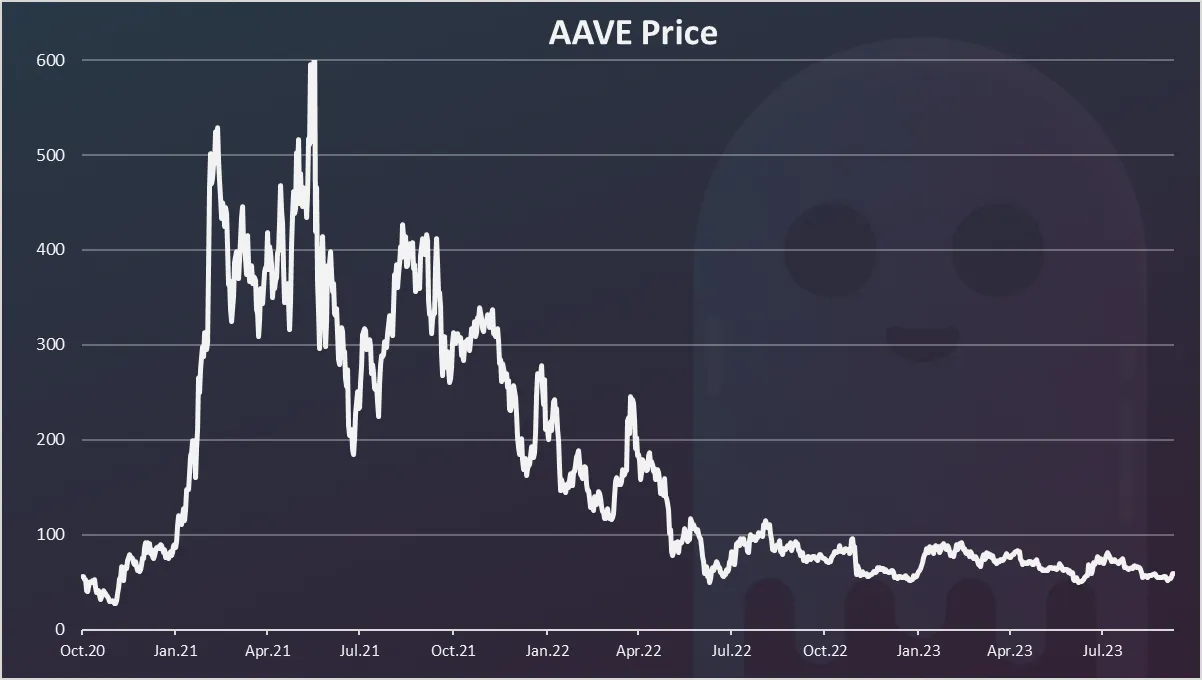
Aave reached its top of $600 back in the summer of 2021.
Since then, the price has been going down and now it is around $60. It is a classic example of more than 80% drop in a price of an altcoin. But the protocol kept on going even trough the hardest times when a lot of the CEXs providers like Celzius and others have bankrupted. Its security and utility still remain.
While the price of the token has taken a beating, it still managed to keep its value and the protocol is now ranked in the top 50 on the overall crypto market cap.
All the best
@dalz