If you are manually trading .. The ABC pattern is a simple yet effective trading strategy that is based on identifying specific price patterns in a financial instrument's chart. The strategy is designed to help traders identify potential turning points in the market and make informed trading decisions.
Here is a simple trading strategy based on the ABC pattern:
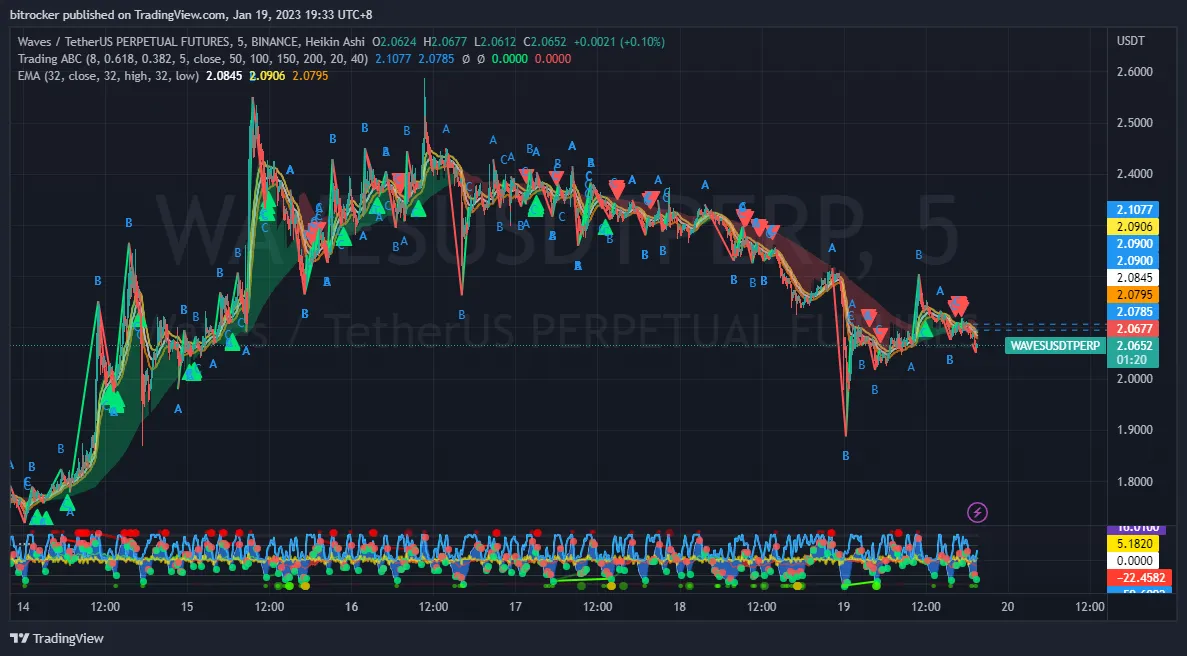
Identify the ABC pattern on the chart: The ABC pattern is made up of three distinct price swings, labeled A, B, and C. Point A is the starting point of the pattern, point B is the retracement, and point C is the completion of the pattern.
Confirm the pattern: The ABC pattern is considered valid if point B is between 38.2% and 61.8% retracement of the move from point A to point C. Additionally, the move from point A to point C should be at least equal to the move from point A to point B.
Enter a long position at point C: Once the ABC pattern is confirmed, traders should enter a long position at point C, with a stop loss placed below point B. The target for the trade can be set at a Fibonacci extension level, such as the 161.8% or 261.8% level.
Enter a short position at point C: Alternatively, if the market is in a downtrend, traders can enter a short position at point C, with a stop loss placed above point B. The target for the trade can be set at a Fibonacci extension level, such as the 161.8% or 261.8% level.
Here is the link to the indicator which you can use to help you chart out ABC patterns if you do not already know how.