Hello there. Two months ago, I shared a gold chart. We started at $1816. After seeing the 1900$ levels, we are back to the 1770$ level again. Today I will share the current version of my gold chart. I will also add the silver chart that I follow.
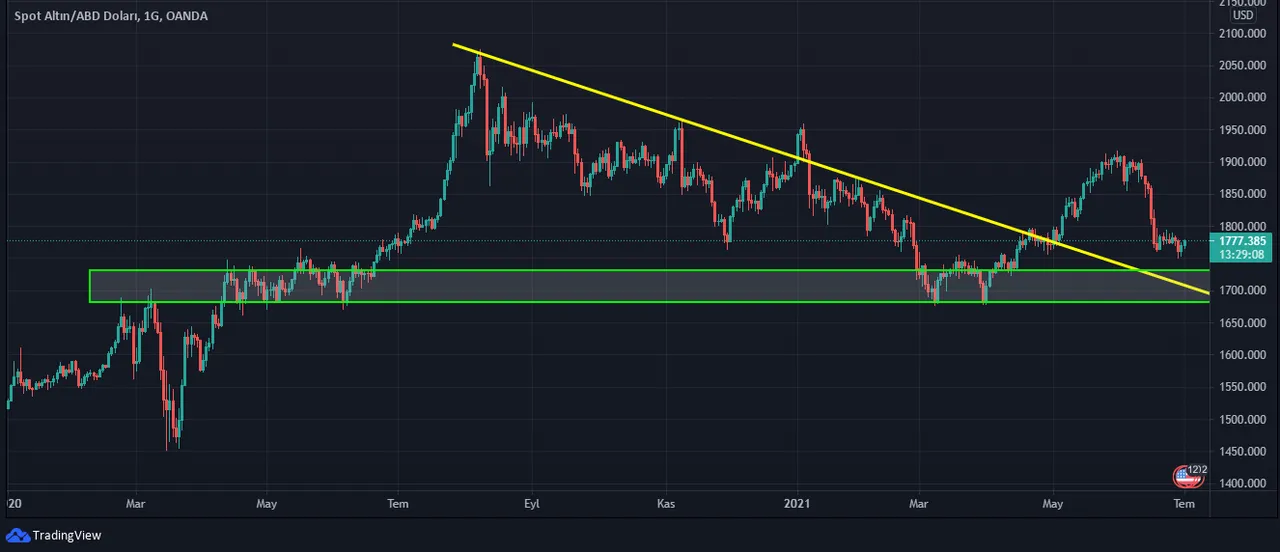
As can be seen in the chart, there is a supply and demand region at the level of 1680-1730. The previous high above $1900 price will be an important resistance. Below, the price of $1450 is waiting for us as an important support.
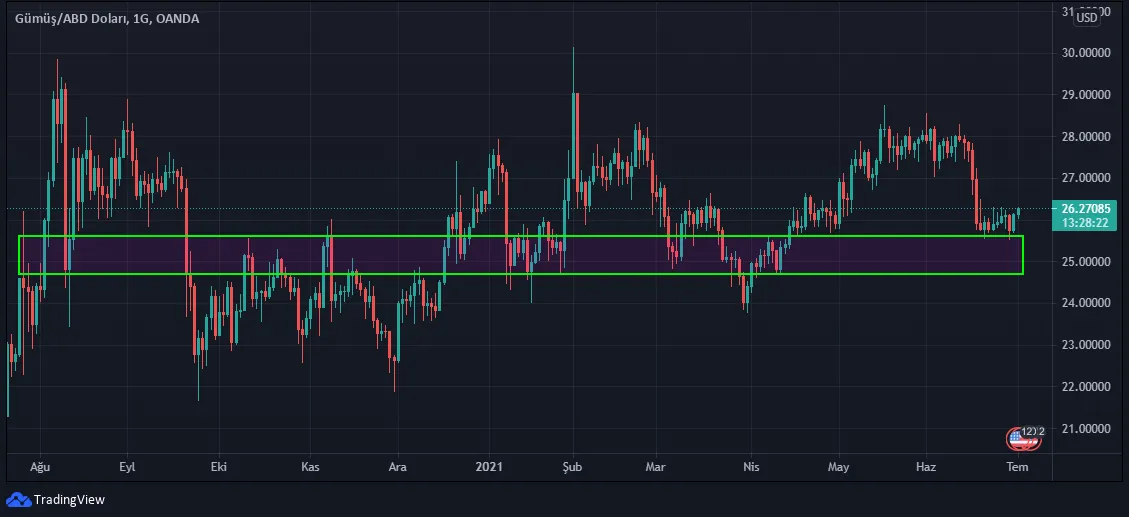
As we understand from the silver chart, there is a supply-demand region at the 24-25 level. Since July 2020, it has been fluctuating between $21 price and $30 price range. These prices should be followed closely for uptrend/downtrends.
As a result; In the long run, gold and silver have consistently yielded. But in the short term, stocks, cryptocurrencies, etc. risk investment instruments. If you are trading on a short-term basis, you should follow the price movements very well. I am not giving investment advice. It would be more beneficial to see this sharing as an educational work. See you in new posts.
Note: I translated from Turkish using Google Translate. Sorry for the translation mistakes.