Hello again lions. About a month ago, I shared an analysis chart of LEO, BLEO tokens. We have been trying to complete the bottom level for almost a month. Bleo continued to oscillate in the $0.20-$0.35 range. I haven't made any changes to my chart. I just stretched the lines to the right. Since almost a month has passed, I can share my Bleo chart with you.
I did not add a Leo graphic in this post. It looks a little complicated. There is another reason. Now Leo and Bleo started to move in parallel. However, there is a very small price difference between them. Again, I'm not sharing basic data. We will just look at the price chart and interpret it.
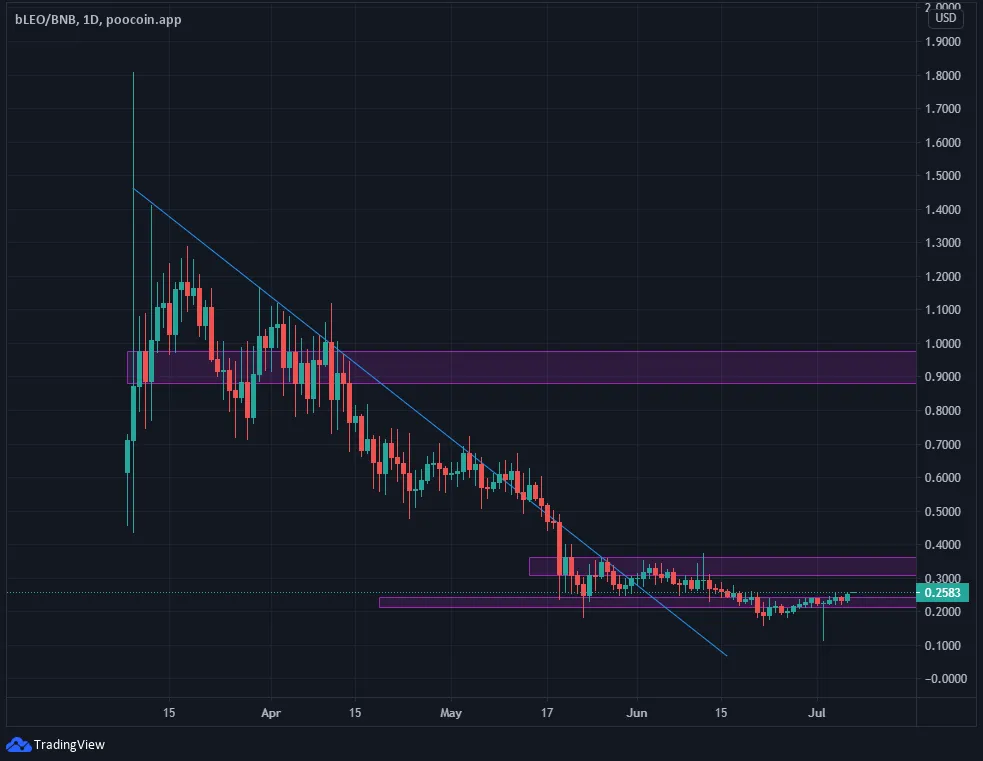
Image: source
As we can see on the chart, a small zone was formed above the $0.20 level. I hope we have completed the bottom formation 😃 The above 0.26-0.36 level is important for us. At this level, a supply-demand zone has formed. We can test this place over and over. Or we can pass in a single lover. It all depends on the demand for Leo.
I do not give investment advice. It would be more beneficial to see this sharing as an educational work. See you in new posts.
Note: Translated using google translate. Sorry for the translation mistakes.