
Bitcoin's price climbed close to 2% in the past 24 hours and is currently trading just above $57.600, according to CoinGecko.
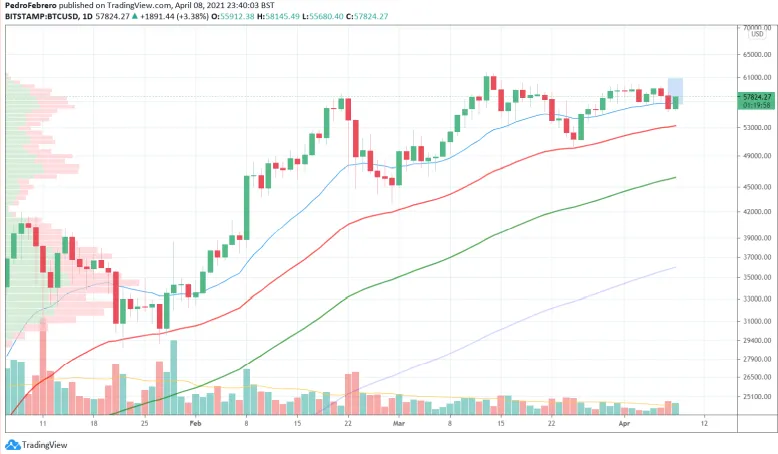
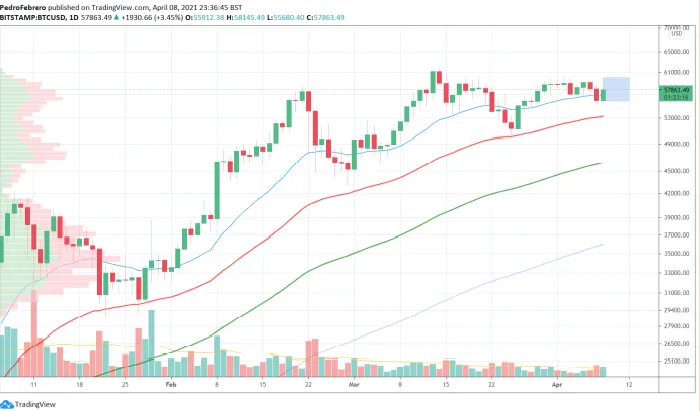
BTC/USD is currently trading within the predicted range after dipping below the 21-day Simple Moving Average (light blue). Selling volume has increased, which points to a continuation of the dip, most likely toward the 21-day Modified Moving Average (red), close to $53,000, if buyers do not come to the rescue.
There's still some hope for bitcoin’s price in the short term; however, buying volume would have to remain entirely above this week's average.
In addition, looking at the Volume Profile Visible Range (VPVR) on the left of the chart shows that BTC/USD has entered a high-order volume price range. In other words, there's a strong chance bitcoin will trade below $60,000 for a while.
In terms of news, Omkar Godbole reported in CoinDesk that "A popular price-chart indicator known as the Bollinger bandwidth suggests” that “bitcoin could soon chart a big move – up or down." This also takes into account the current low levels of volatility the bitcoin market is experiencing.
To conclude, we believe once bitcoin's price reverses its trend, it will soon reach a fresh, all-time high. However, we remain bearish on BTC/USD while:
- BTC/USD does not close the day above the 21-day SMA.
- BTC/USD doesn't move above $59,000.
- Sellers dominate BTC/USD daily volume.
Traders Thoughts
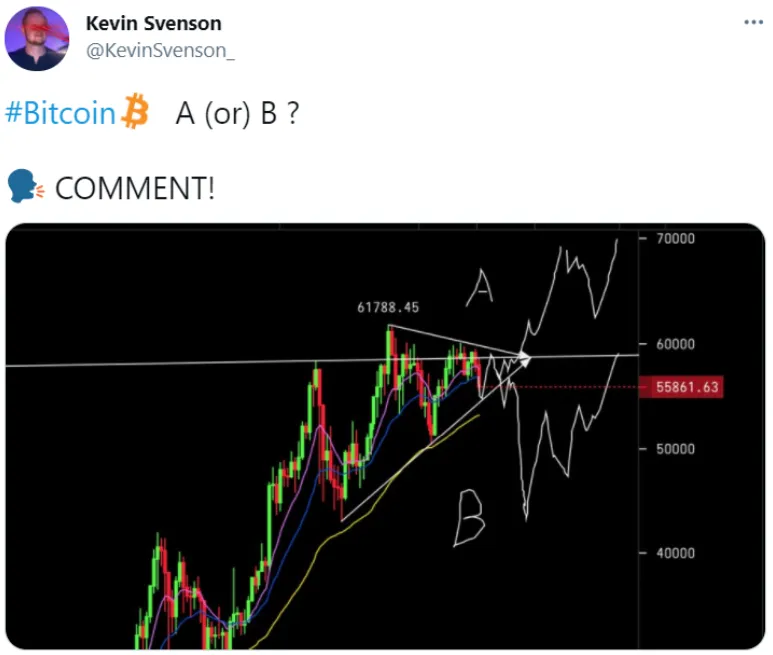
Today's first tweetstorm comes from Kevin Svenson, a YouTuber and cryptocurrency trader.
In his post, Svenson shared bitcoin's price chart and added two converging trend lines, showing resistance at the top and the other support at the bottom.
He then speculated on the path that bitcoin's price could take: a bullish path (A) or a bearish path (B). Although nothing is certain, probabilities point to a possible momentary downtrend; however, bitcoin's price is still trading within the range shown in the chart.
If bitcoin's price goes below $55,000, we will update our view from bullish to bearish.
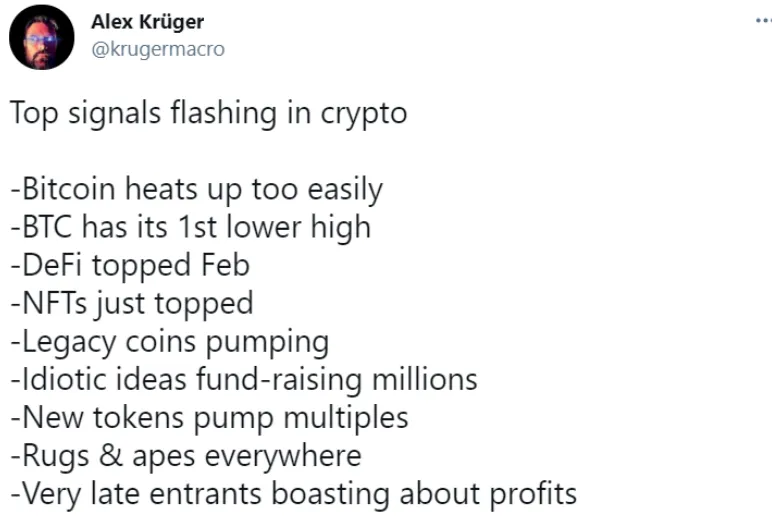
The following post comes from Alex Kruger, an economist and trader with more than 70,000 Twitter followers.
In the post, Kruger points to the signals that could indicate that bitcoin’s price and the overall cryptocurrency market have hit the current cycle top.
He stated that:
“-Bitcoin heats up too easily
-BTC has its 1st lower high
-DeFi topped Feb
-NFTs just topped
-Legacy coins pumping
-Idiotic ideas fund-raising millions
-New tokens pump multiples
-Rugs & apes everywhere
-Very late entrants boasting about profits”
We want to highlight that while Kruger brought up some perfectly valid concerns, we still believe there’s room for the cryptocurrency market to grow.
The points Kruger makes are certainly worthy of mention, but they extend to the entire duration of the bull run. In other words, until bitcoin’s price reaches its all-time cycle high, the cryptocurrency market will remain euphoric.
As economist John Maynard Keynes famously said:
“The markets can remain irrational longer than you can remain solvent.”
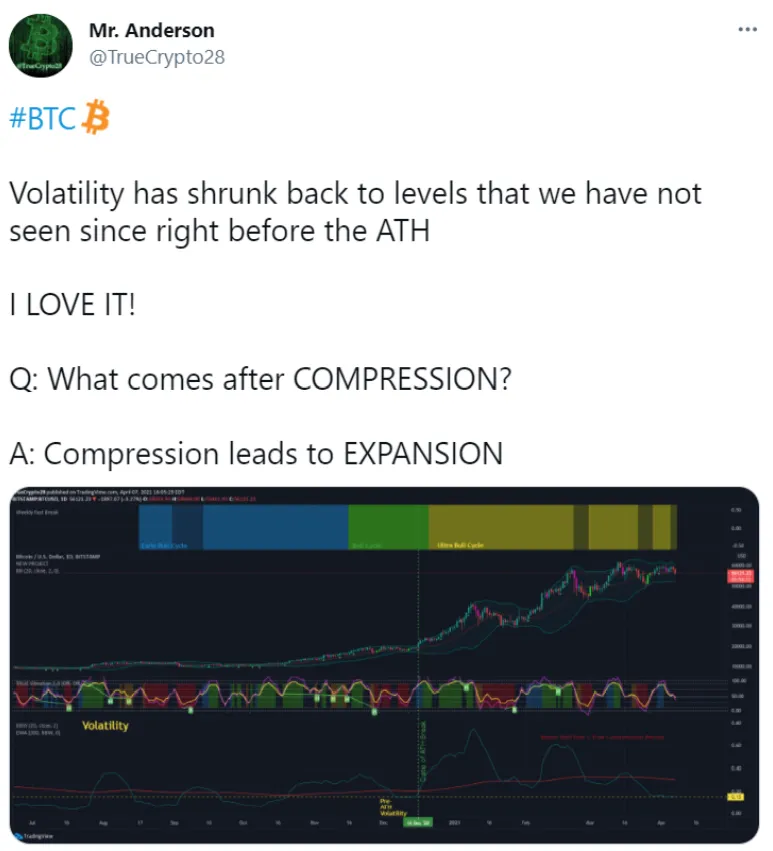
The following tweet comes from Mr. Anderson, whose Twitter account describes him as a “TA Trader.”
Mr. Anderson shared bitcoin’s daily price chart and added the "Volatility" indicator at the bottom, pointing out that once this indicator crosses the red line, it usually points to a "compression period," or in other words, a consolidation period.
While volatility is low, bitcoin could still experience a significant move.
As Mr. Anderson explains:
"Q: What comes after COMPRESSION? A: Compression leads to EXPANSION."
Hence, he expects bitcoin's price to enjoy a rapid expansion once buyers come into the market and volatility resumes.
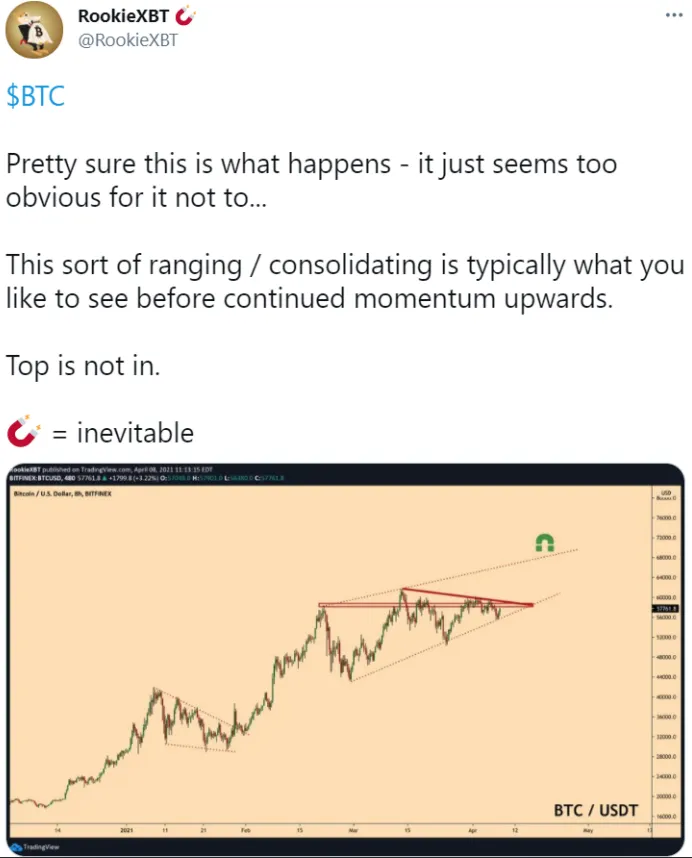
The last post of the week comes from RookieXBT, a cryptocurrency trader with over 150,000 Twitter followers.
In this post, he shared the eight-hour price chart of bitcoin and wrote that
“This sort of ranging/consolidating is typically what you like to see before continued momentum upwards.”
As he explained further, the “Top is not in,” meaning that the current cycle’s record price has not been attained. Similar to Mr. Anderson, RookieXBT thinks bitcoin’s price is simply consolidating before making another sudden move to the upside.
To conclude, the trader also identifies current resistance, which according to him, is between $58,000 and $59,000. Once bitcoin breaks above $60,000, it should continue to move toward much higher price ranges.
Price Prediction
At the time of this writing, bitcoin is trading close to $57,600, according to CoinGecko. Since yesterday, BTC/USD has gained north of 1.5%.
As we wrote in the introduction, we'll remain bearish on bitcoin's short-term price action while it trades below its 21-day SMA. However, if buyers flock to the crypto space, that trend could soon reverse, and a new rally could ensue.
How do we think the price will trade today and during the weekend? As shown in the above chart, we believe that bitcoin could approach $59,000 in the next few days, as long as buyers return.
There's a chance the coin breaks this level by the end of the week, but buying volume would need to grow substantially for this to happen; hence we're not assigning that outcome a significant probability.
If it fails to hold this level, we think a drop toward $56,000 near the 21-day MMA could occur. However, we should note that this is highly unlikely.
To finalize, the VPVR shows a high number of buy orders between $46,500 and $50,000. It also indicates that there are almost no sellers left above $62,000.