It's been an intense past week for working on the chart as I've pushed to clean up some of it's rough edges to make it more presentable and useable, with many a late night and early starts, I'm feeling a little fried, but happy with the progress.
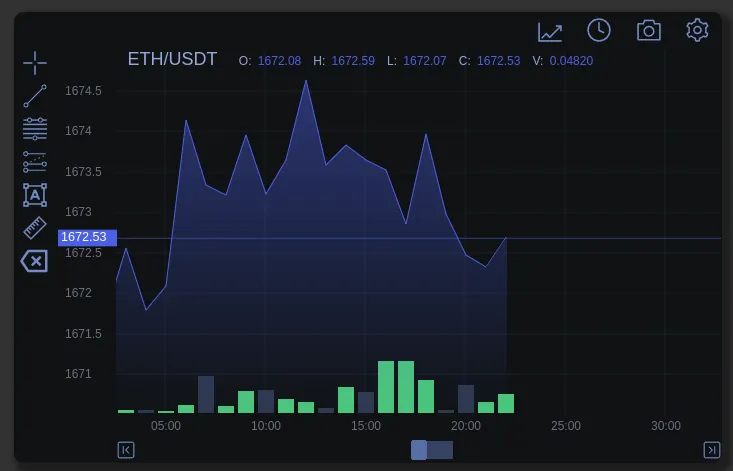
After putting off implementing a solid area line graph render for the chart, some one recently gave me a little push to finally program it. Programming it was quite straight forward, so I'm not sure why I avoided it, as I had made prior preparations for it's eventual implementation, which made it painless and straight forward.
While these sort of charts do make a visual impression, for myself, they are not useful when it comes to trading.
I've come to like this colour theme, although the blue light exposure is increased if staring at this late at night. I think I'll pull this into Krita, my favourite digital image editor (there's no such thing as digital paint!) and play with the colour balance and try out some other colour variations.
There's been a slew of minor bug fixes. The other item of news I'm keeping for the next post.