Hi there. Last week I talked about using Monte Carlo statistical simulations for estimating the value for pi.
In this post, I share a Rshiny app that I made for this.
App Link: https://dkmathstats.shinyapps.io/monteCarlo_estimatePi/
Random points in a 2 by 2 unit square were generated. A unit circle is inside this two by two square. A randomly generated point (x, y) is considered in the unit circle if it satisfied the equation  .
.
The estimation for pi is four times the ratio of number of points in the circle over the number of simulated points (number of points in square). This ratio is based on the ratio of the area of the unit circle divided by the area of the 2 by 2 units square which gives pi/4. (Multiplying the ratio by 4 gives pi)

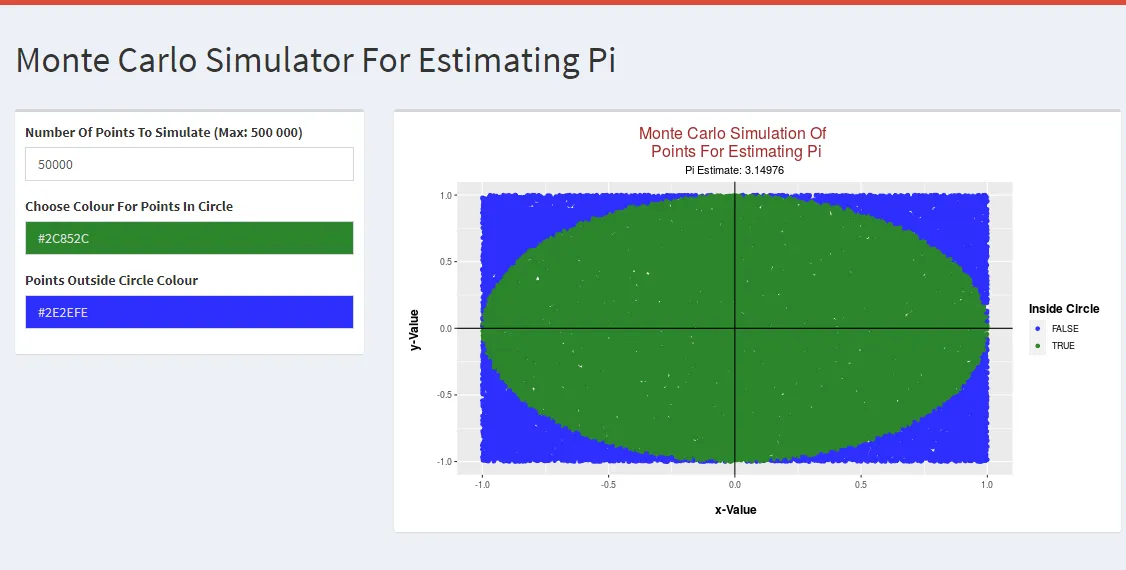
The RShiny app (with ShinyDashboard) uses the R programming language for simulation of points. I have included a visual plot of the simulated points and an estimate for pi based on the number of simulated points.
App Screenshot
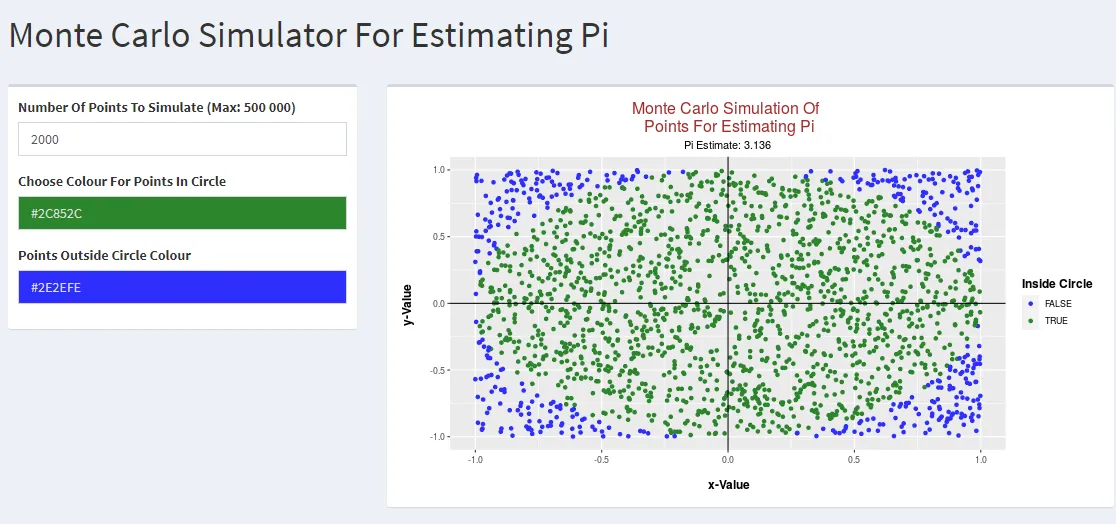
The above screenshot is the estimation for pi simulation with 2000 points. This next screenshot is based on 50000 simulated points. Increasing the number of points fills the circle and square more which gives a more "accurate" estimate for pi (from the frequentist statistics perspective).
Screenshot Two