Hello there. I haven't been looking at the Ripple chart for a long time since the Flare airdrop. And I wasn't interested in its price. Joint sales, lawsuits, delisting from exchanges, etc. Xrp got a good kick. Thus, marketcap dropped to 7th place. Its price fluctuates in the $ 1.3-1.5 range.
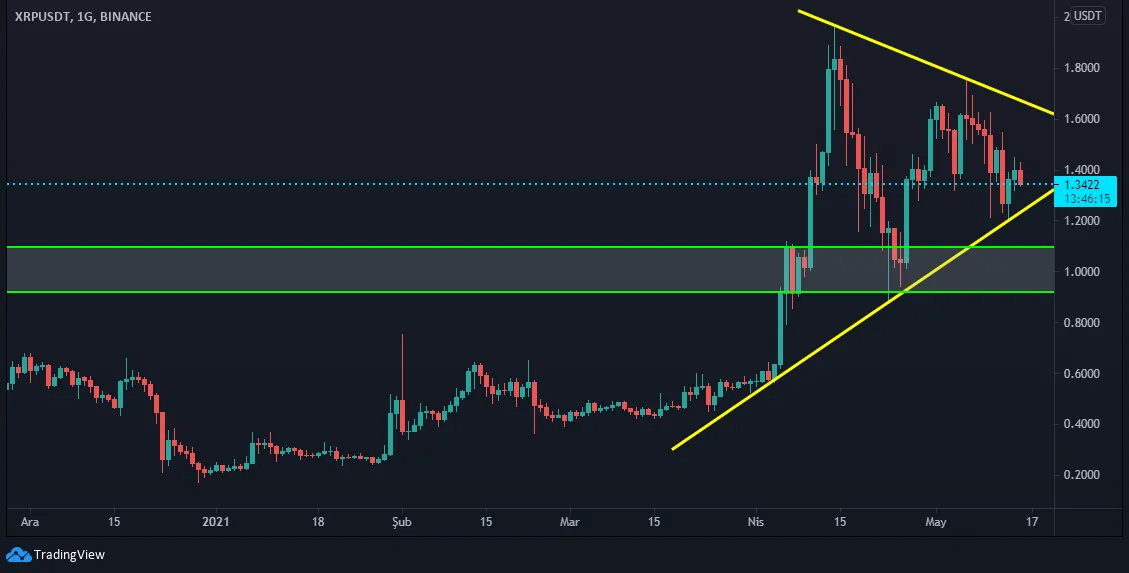
The screenshot above is taken from the Binance exchange, XRP / USDT price data. The graph is daily. As can be seen in the chart, there is a triangle formation. Below is a supply and demand zone in the price range of $ 0.9 to $ 1.1.
There is a general negativity in the crypto money market, with the news effect. The lower part of the triangle and the supply-demand zone below should be followed carefully. Above, the upward break of the triangle and a few candlesticks should be followed.
I do not give investment advice. You should make your investment decisions yourself according to your psychological and financial situation. It will be more beneficial for you to see the chart and price data as an educational study. See you in new posts.