Hello friends of $CHARY, Friends of $HIVE and all others,
The CHARY Project Is Frozen Now
I think, this will be my last CHARY news.
I have thought about this project and came to the result, that I want to freeze it.
What does this mean?
It means, that at the moment, I don't want to invest more time or money into the CHARY project.
So you will not receive the statistics any more and I leave the community on it's own.
Is CHARY dead?
It depends on the community.
At the moment I don't have time nor motivation to do it. After some housecleaning, new free riders appear and want to earn some $CHARY. If noone cares about them, then too much money goes to the wrong persons.
If some people care about the content in CHARY (upvote good content, downvote bad content, give comments to the members,...), then CHARY still has a chance to grow and help people.
If a group of people wants to help CHARY ands asks me to go on, then I probably will do it. The token itself and the community still exists, we just need to fill it with live.
Conclusion of the CHARY project
It was a test. I wanted to see, if donation to charity groups can be done by blockchain without a man in the middle.
It can not. At least a community is needed to care for the right recipients, and this costs money.
Was CHARY in vain? -> Definitely No. We have learned a lot. I have created my own token. I have learned what money is and how it works. I have learned to collect statistics via ELK and raspberry pi. And last but not least, we could help some people.
CHARY Statistics for the last month:
The timeframe is from 2021/08/01 - 2021/08/31.
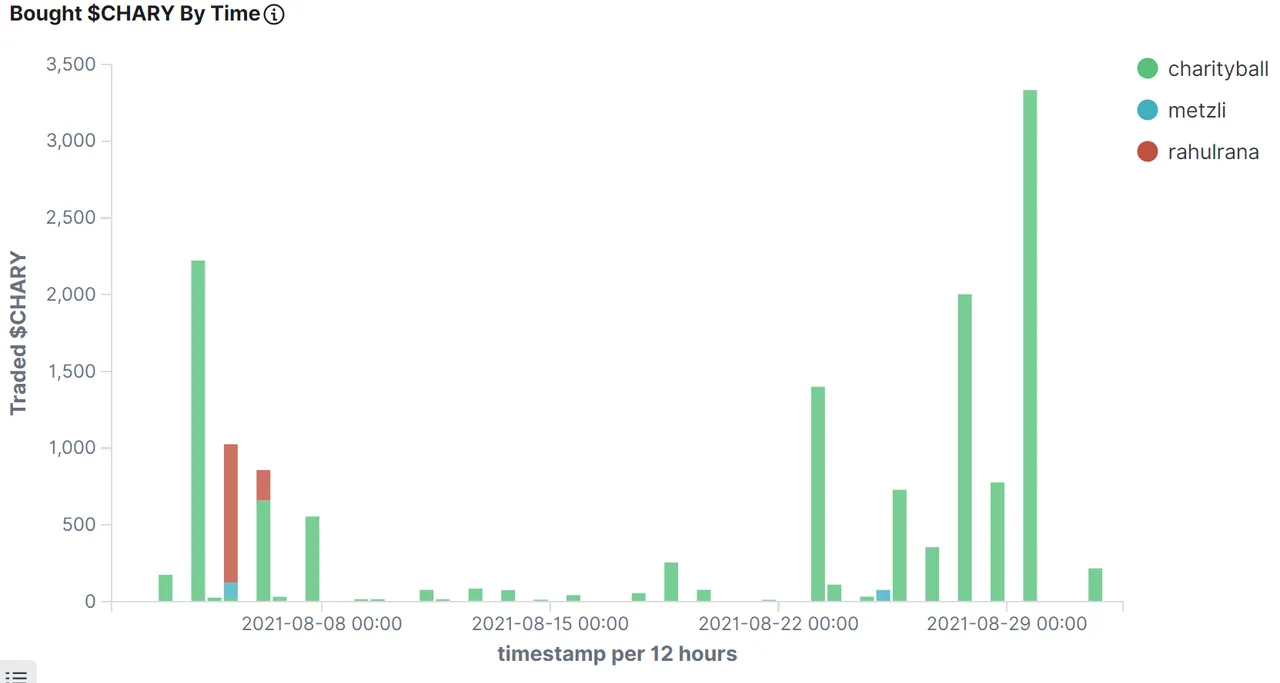
Bought $CHARY By Time
This figure shows who has bought how many $CHARY at which time:
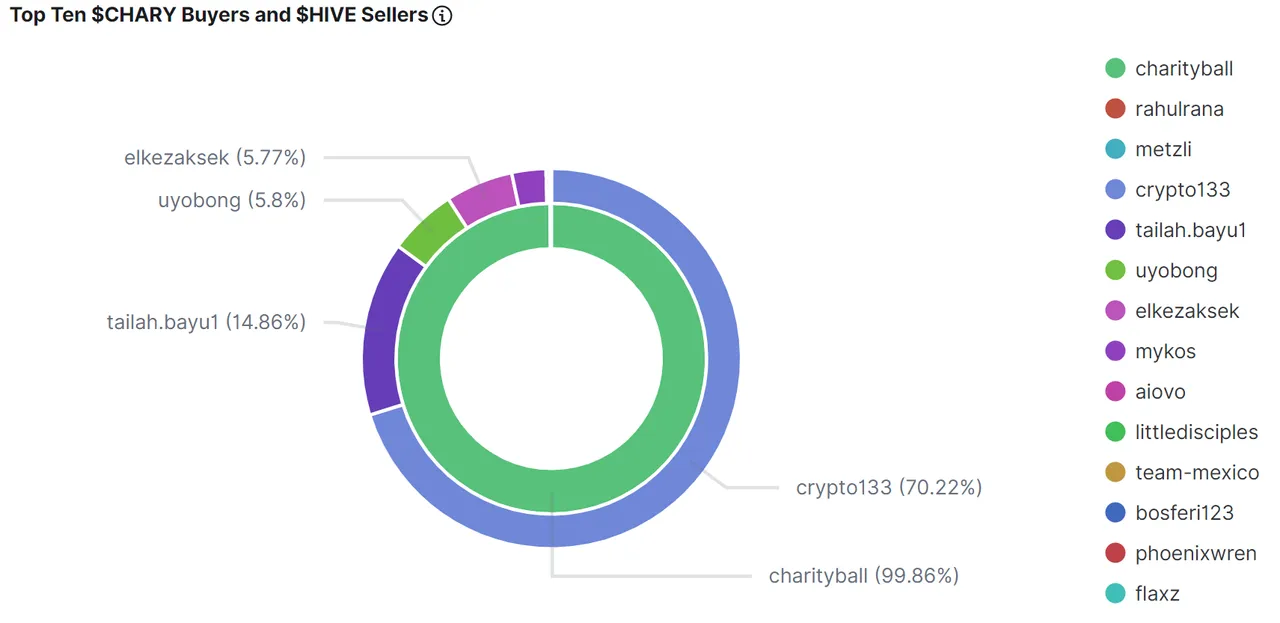
Top Ten $CHARY Buyers and $HIVE Sellers
The inside of the circle shows the buyers of $CHARY, ordered by $HIVE they have spent. The outside shows the recipients of that $HIVE (recipients of $CHARY):
Commulated Amount Of Bought $CHARY Per Person
This figure shows the top ten $CHARY buyers, how much they got and how much $HIVE they spend for this. It is sorted by $HIVE, that was spent:
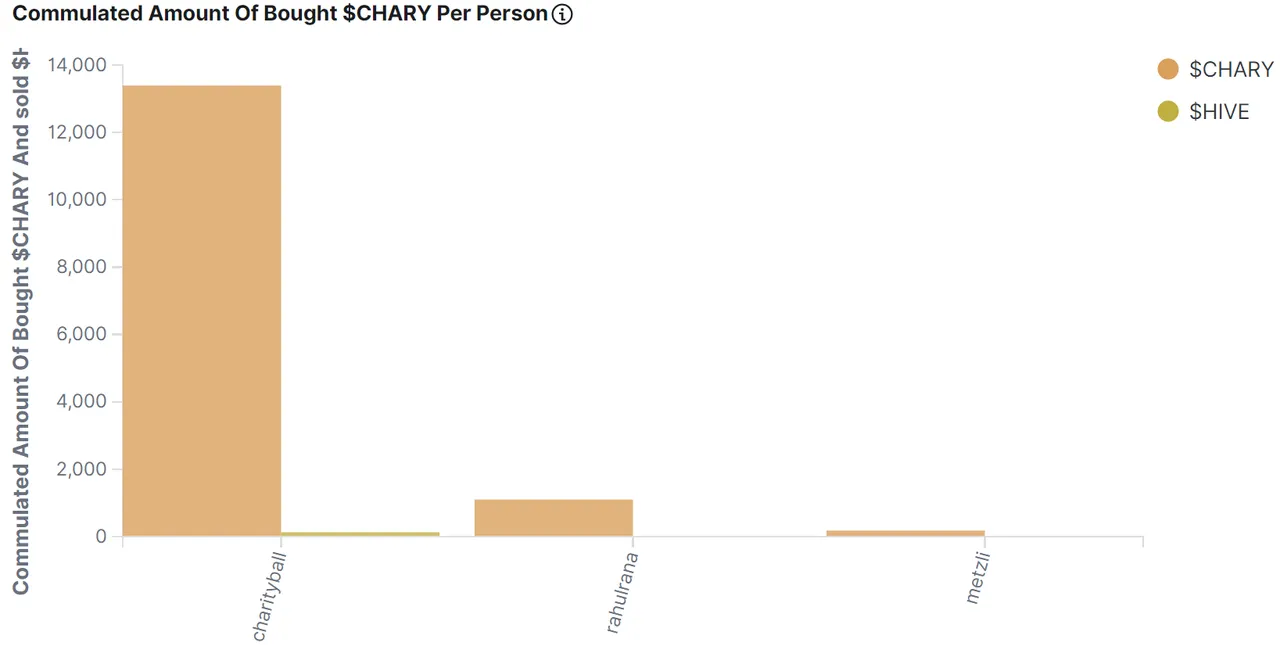
Table Of Top 20 $CHARY Buyers
This table shows the top ten buyers of $CHARY sorted by the $HIVE, they have spent:
| buyer.keyword: Descending | Sold $HIVE | Bought $CHARY | Avg. Price |
|---|---|---|---|
| @charityball | 127.8837157827802 | 13392.74990645051 | 0.009572105384186694 |
| @rahulrana | 0.14290380105376244 | 1099.259994506836 | 0.00013000000035390258 |
| @metzli | 0.03769511027712724 | 177.1869942508638 | 0.00023999999975785614 |
Commulated Amount Of Sold $CHARY Per Person
This figure shows the top ten $CHARY Sellers, how much they sold and how much $HIVE they got for this, sorted by $HIVE:
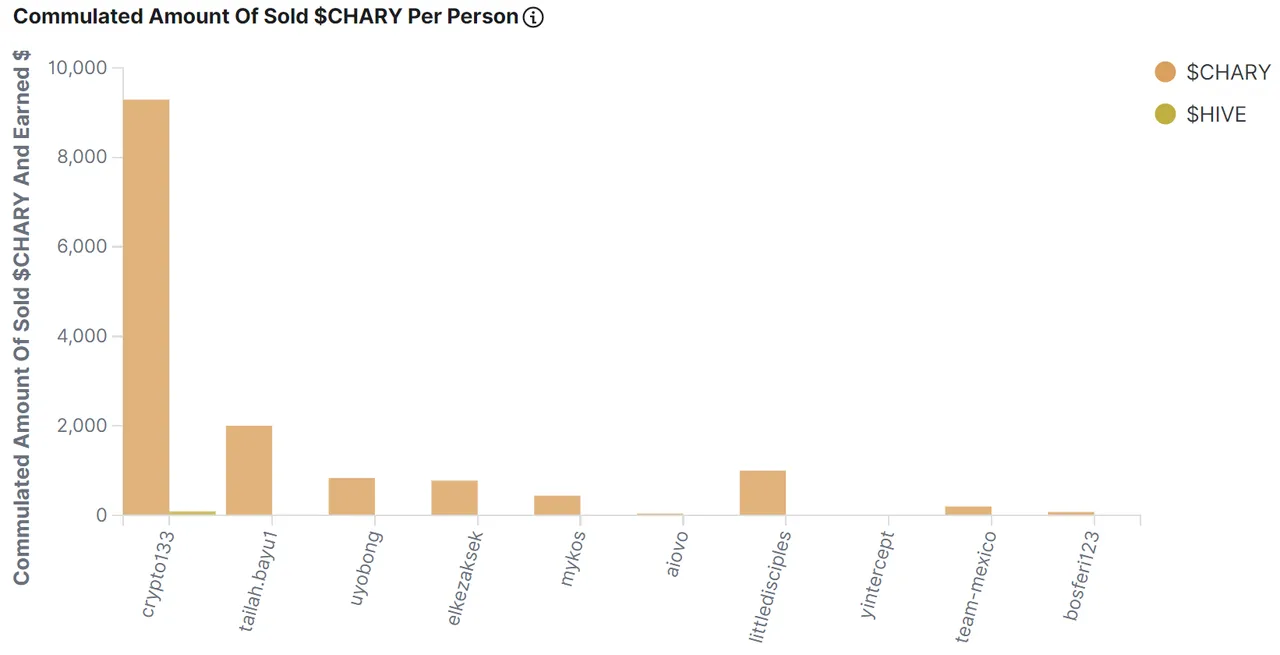
Table Of Top 20 $CHARY Sellers
This table shows the top ten sellers of $CHARY Sorted by the $HIVE, they have got:
| seller.keyword: Descending | Earned $HIVE | Sold $CHARY | Avg. Price |
|---|---|---|---|
| @crypto133 | 89.89638085337356 | 9293.080959707499 | 0.009766896737032923 |
| @tailah.bayu1 | 19.025793075561523 | 2002.7149658203125 | 0.009499999694526196 |
| @uyobong | 7.4269877672195435 | 834.4929809570312 | 0.008899999782443047 |
| @elkezaksek | 7.381499767303467 | 777 | 0.009499999694526196 |
| @mykos | 3.7206561267375946 | 440.5820007324219 | 0.008333333457509676 |
| @aiovo | 0.3947511911392212 | 40.69599914550781 | 0.009700000286102295 |
| @littledisciples | 0.12999974191188812 | 999.9979934692383 | 0.00013000000035390258 |
| @yintercept | 0.037647001445293427 | 4.183000087738037 | 0.008999999612569809 |
| @team-mexico | 0.025836069136857986 | 198.73899841308594 | 0.00013000000035390258 |
| @bosferi123 | 0.024548480287194252 | 76.71399688720703 | 0.00031999999191612005 |
| @phoenixwren | 0.00014662999819847755 | 0.4729999862611294 | 0.0003100000030826777 |
| @flaxz | 0.00006798999675083905 | 0.5230000019073486 | 0.00013000000035390258 |
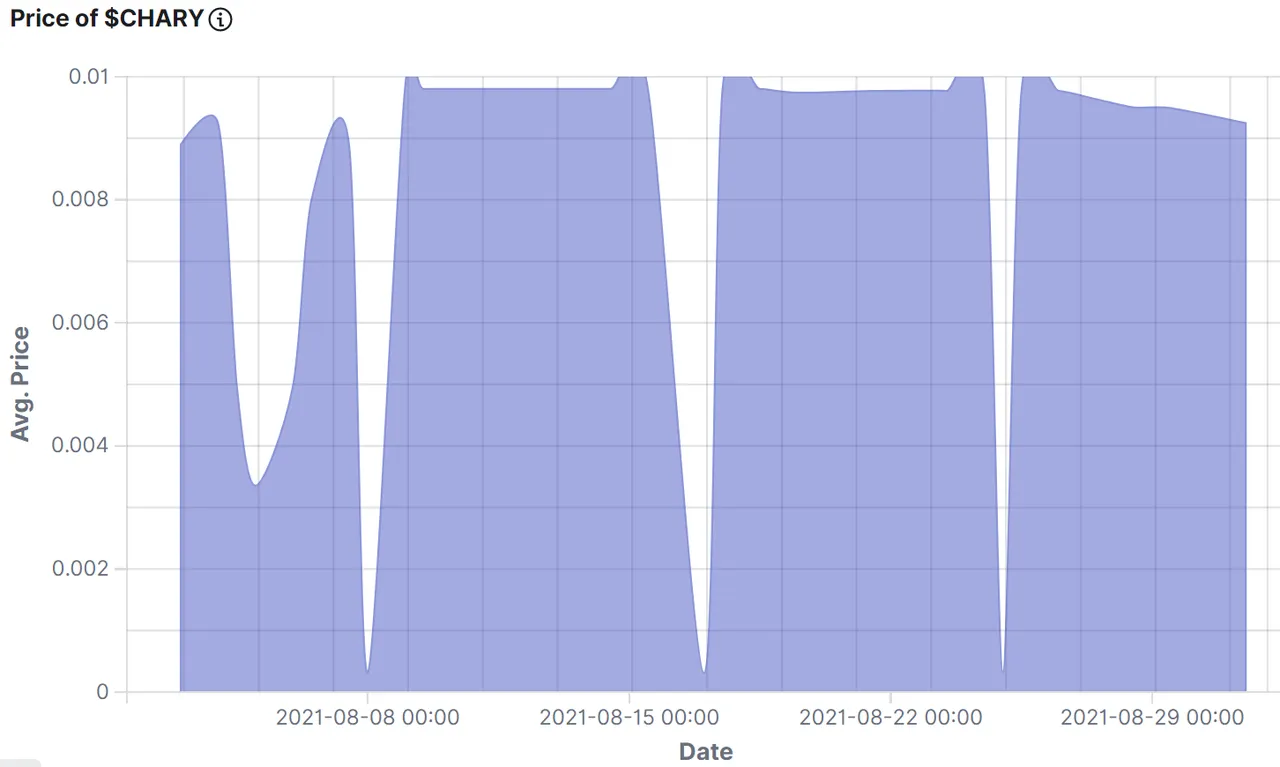
Price of the $CHARY
This figure shows the smoothed price of $CHARY:
$CHARY Summarize Metrics
This table shows how much $HIVE was given by buy-requests, that where equal or higher than the sell order vs. sell-requests, that were equal or lower than the buy order.
If the buy-requests where higher than the sell-requests, then money comes into the system and the value of the token increases.
Under the total line one can see the sum of $HIVE and sum of $CHARY that changed the ownership and the average price of $CHARY for the last period.
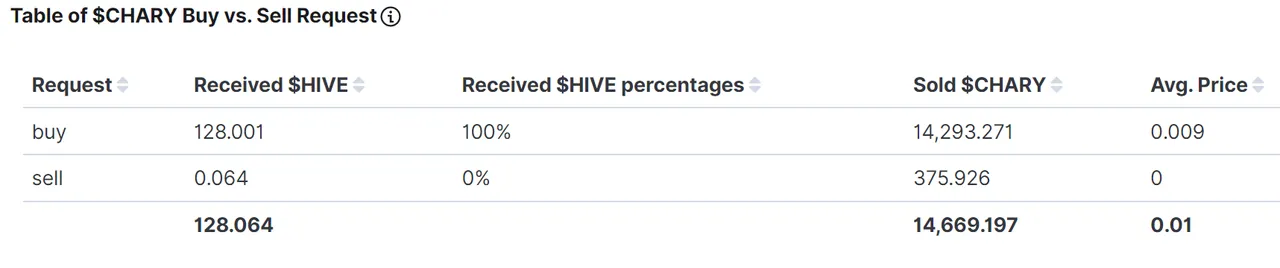
The average price of the token in the picture is wrong, actually it was: 0.008 $HIVE/$CHARY
Todays value of $CHARY:
The price of $USD/$HIVE = 0.54527259 . The price of $HIVE/$CHARY = 0.00949000 . The price of $USD/$CHARY = .00517463
Disclaimer
All stats are without warranty.
They are taken from:
curl -XPOST -H "Content-type: application/json" -d '{ "jsonrpc": "2.0", "method": "find", "params": { "contract": "market", "table": "tradesHistory", "query": { "symbol": "CHARY"}, "limit":1000, "offset": 0 }, "id": 1 }' 'https://api.hive-engine.com/rpc/contracts'
I have put them into logfiles and uploaded them to Kibana, from which I took the screenshots.
If you find errors, please tell me!
If you want to see other token statistics, please contact me. I can create them weekly or monthly if I get some upvotes for it.
For more details see here: How I Have Set Up Elasticsearch And Kibana On My Raspberry Pi To Monitor Token Activities and here: Do You Want To See Statistics Of Your Favorite HIVE Token? or on github.
Regards, Achim Mertens