Hi fellow Hiveians,
Today I am publishing my first Data Visualization (Data Viz for short, so you can be one of the cool kids who knows what that is now!) project to have fun and get better at learning Tableau first, then move over to Excel at a later point. I've done a decent amount with Excel for it but Tableau I am still fairly new at so let's give it a shot!

Dusting the Rust
So the visualization component isn't going as smoothly as I was hoping but that's okay with me! Learning this stuff is all part of the fun in my opinion. I've spent the better part of the day trying to massage these numbers and charts into usable, interesting looking data. It's not been very successful but I honestly haven't touched Tableau since about March so I'm not too surprised! I apologize if it looks like crap, I wasn't hoping for a rough start but gotta roll with the punches lol
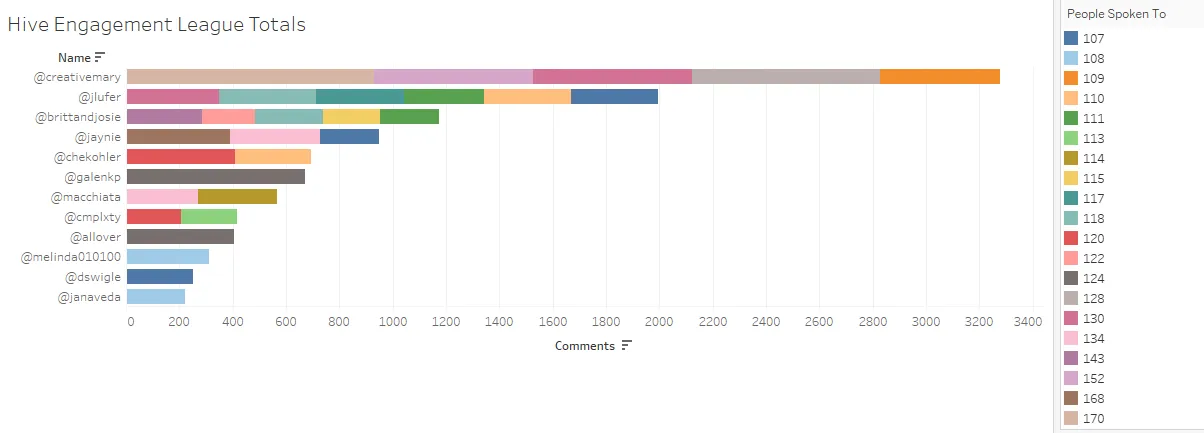
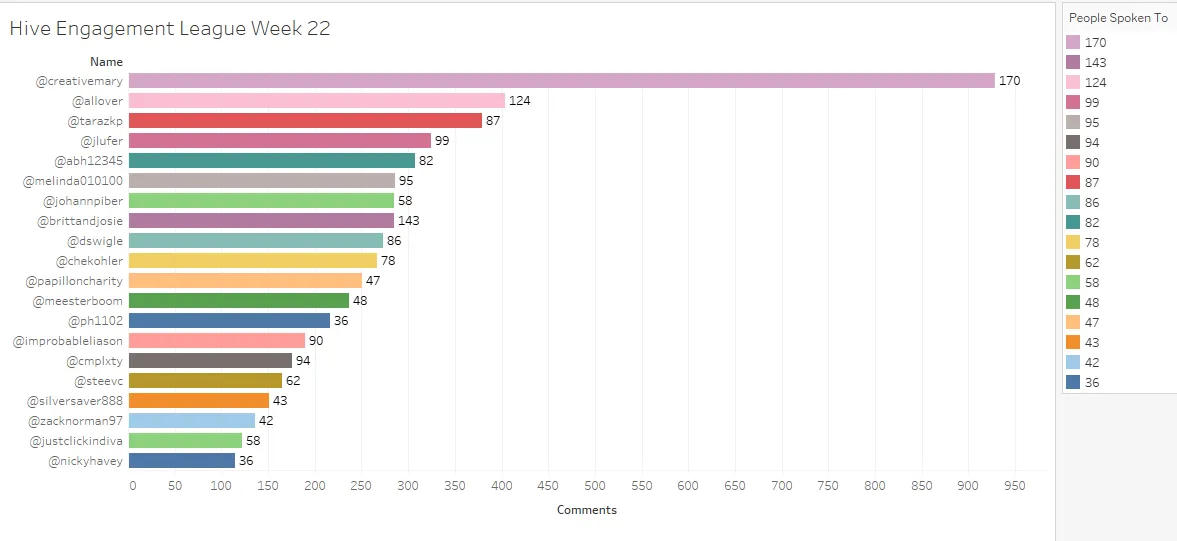
I am trying to make the data look organized and nice with some good bars but here is a sample from week 22. We can see that Mary really stole the show that week as far as the number of comments! What I also wanted to highlight in a cool stacked bar is the difference between the number of comments and the number of unique people spoken to. Mary is obviously doing a great job but some others were able to reach out to a heck of a lot of people and still get pretty good rankings in the league!
So this was my attempt to get the data above to work the way I want. You can see there are stacks of colors under each persons name. The data behind it isn't behaving properly just yet but that's the fun (and frustration) of learning this stuff. Having something you want to achieve is a lot better than playing around with fake data that you don't really know how it should look. I can tell that for example, my comments section is definitely not 400 for the 8 weeks that I have in the data!
Trends
One of the things I would like to try and do is to work on getting some trend data. Asher has been great to highlight at the end of his data segments the total number of votes, self votes, accounts and posts in each one. That's pretty cool to see and I wanted to put that into some trend timelines. I can't yet figure out why Tableau is combining two of my data points to make one really annoying data point but I will figure that out.
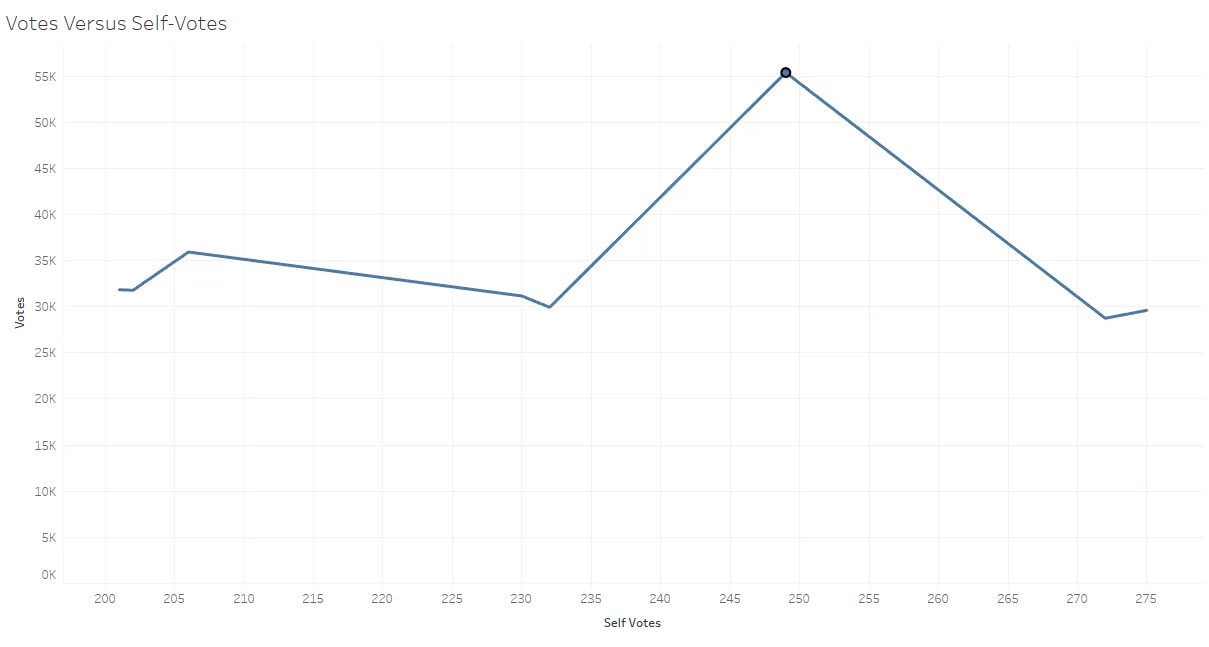
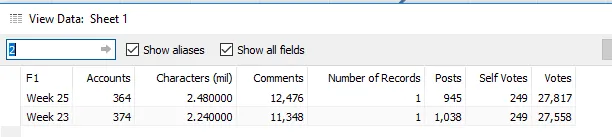
These are the data points that keep getting combined despite my best efforts to stop that.
Now for another measure, Accounts versus Number of Posts
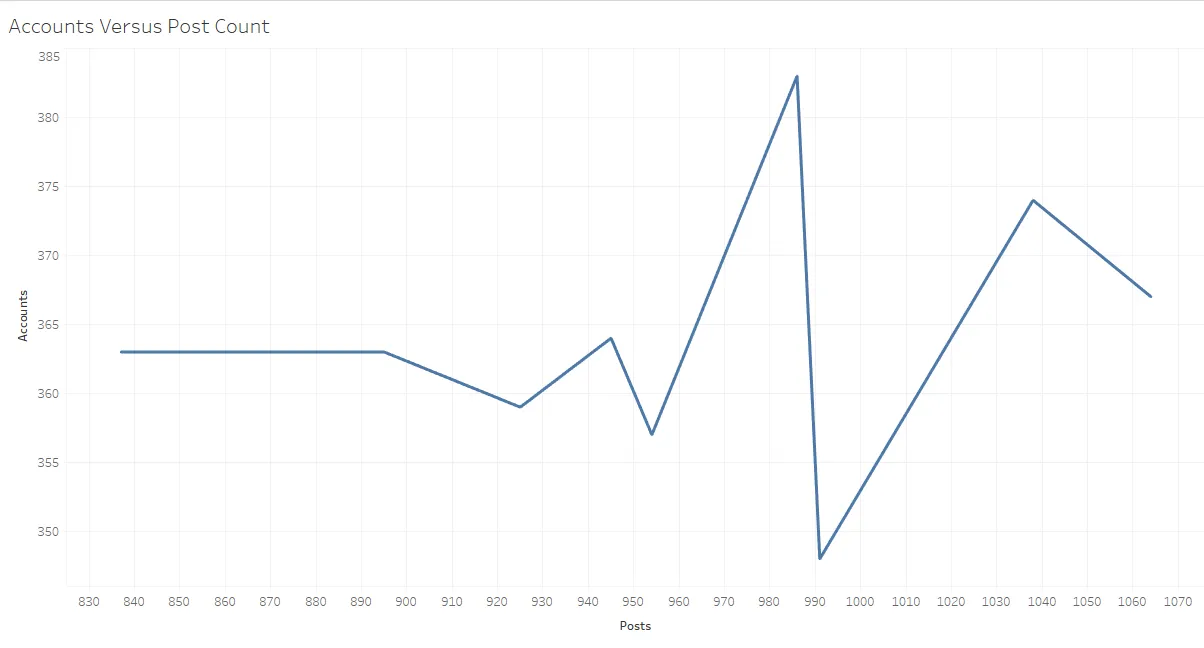
I just want to give a big thank you and shoutout to @abh12345 for the data for this! It was a huge help to get the Excel file of it rather than trying to jot the numbers down from the screenshots.
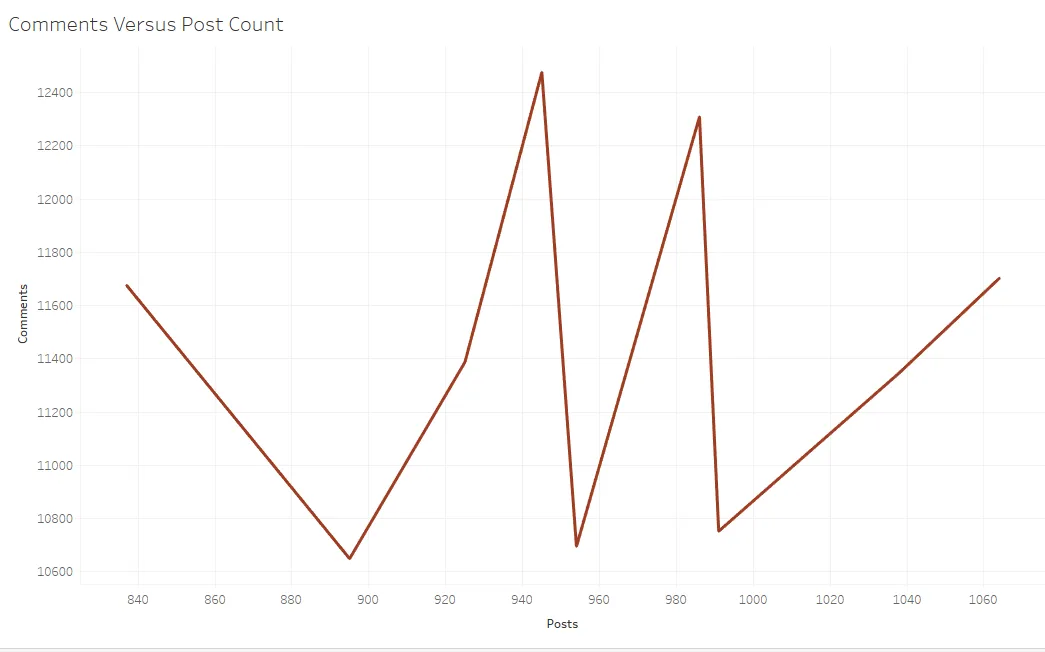
The last one I did for now is Comments versus Posts
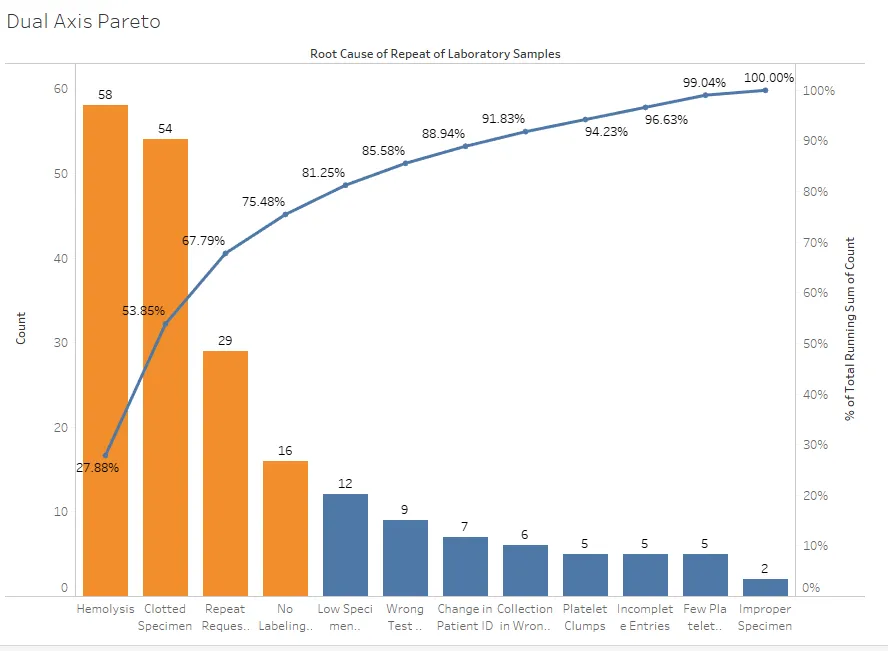
Some of the things we worked on in my Tableau class were pretty cool, we did things like this chart below. Lots of cool measures and different complexities to the data viz style there. I hope to get there with my Hive data someday! It just takes one step at a time..

Did you enjoy this post or my other posts? Please consider following me for more! @cmplxty
Do you want to get paid, in crypto, for searching the internet? Try using and signing up for Presearch to earn some great crypto! I've currently got 1,415 PRE tokens, with a market value of $27.57. It doesn't sound like a lot but when you search using sites like Google you get paid $0! Join Presearch to break Google's stranglehold on the internet searches. If you'd like to sign up, use my referral link below and spread the word!
https://www.presearch.org/signup?rid=513043

Still using hive.blog? Upgrade! PeakD is a much better user-interface, gives loads more information at your fingertips and has some of the best developers behind it. Give it a try, go to www.peakd.com and see how much easier it is. You just need to use Hivesigner or Peaklock some of the most secure ways to log into other Hive frontends.
You can use my referral link to sign up through PeakD and I get to keep an eye on your progress and help you out! https://peakd.com/register?ref=cmplxty