Data Request: Monthly Comment History
The following request was made in the #freecompliments discord server a few days ago:
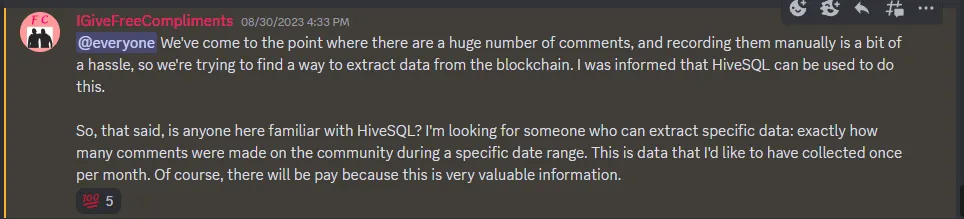
This is in my wheelhouse. Like most advanced skills, it is easy if you know how, but the hard part is knowing how.
Software
I don't like to use SQL, but I have a lot of experience with accessing HiveSQL using Microsoft's PowerBI analytics software. It's a free download, and a powerful piece of software. We're going to dramatically under-use its capabilities for this project!
Data Source
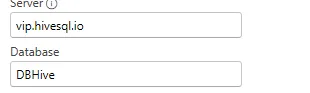
We're going to use @arcange's HiveSQL database for this project. It's the easiest way for a non-engineer to access Hive data. It's publicly funded via the HiveDAO, so go support the latest proposal before you proceed any further!
There's a one-time fee for registration, but after that access is free (as long as it continues to receive HiveDAO funding)! I used to pay monthly for this, and it was worth every penny. Registration only takes a few minutes and then you get access credentials that you can plug into Power BI and you're on your way.
Choosing Tables
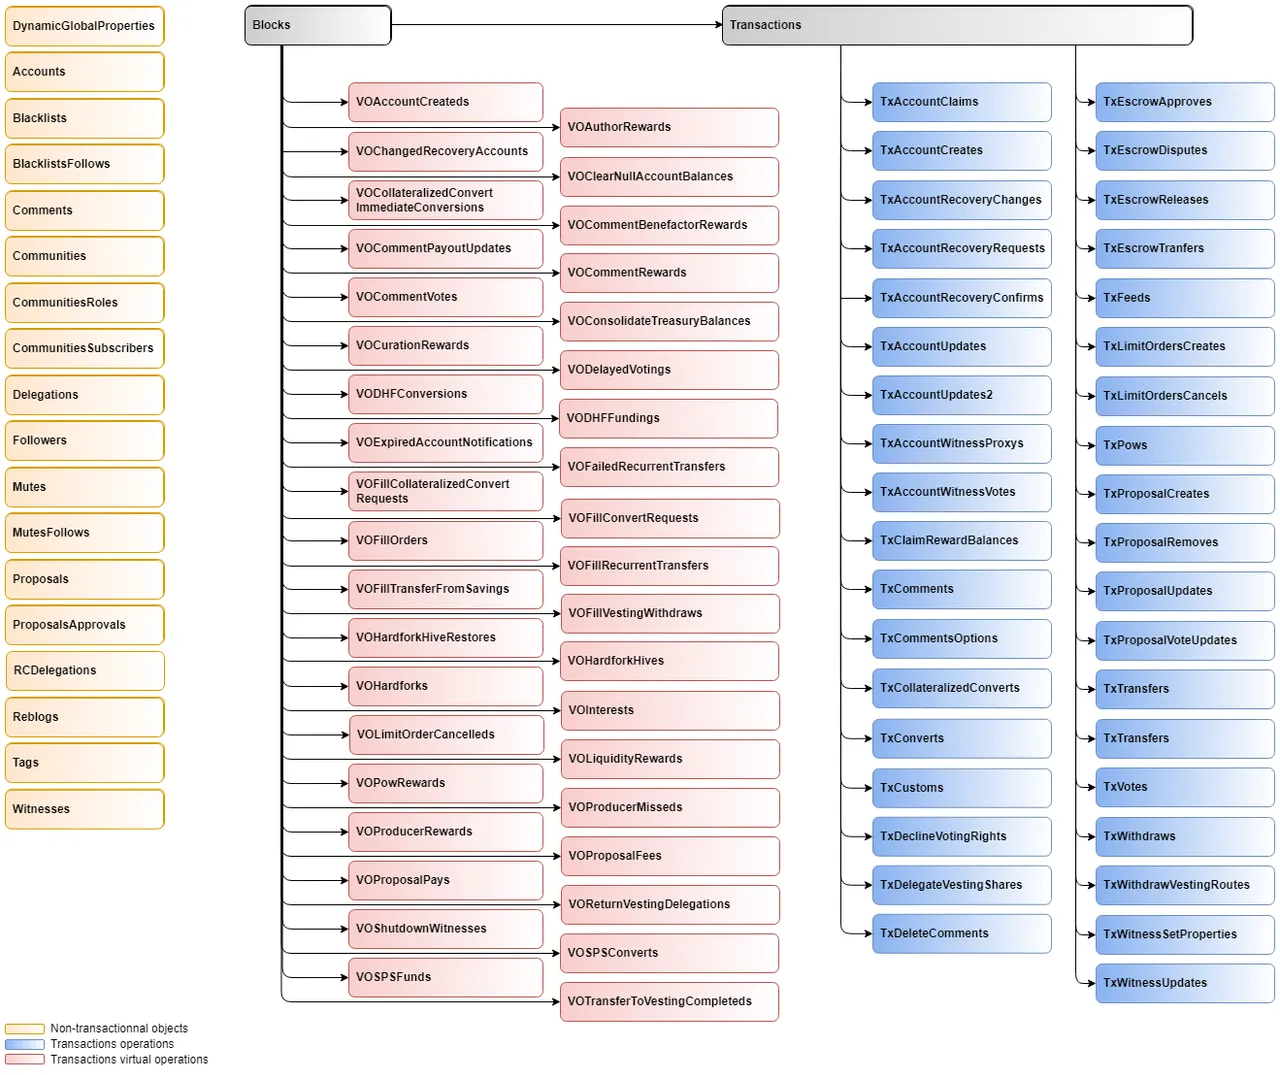
HiveSQL has a lot to choose from, and Power BI will run a lot faster if we only grab what we need. Since we want comments data, we're going to choose the 'Comments' table. We could also use TxComments, but I like Comments better.
Without getting too technical, it takes the comments from TxComments and enriches them with relevant data from other Tx tables. It's just better, in my opinion, but to each their own!
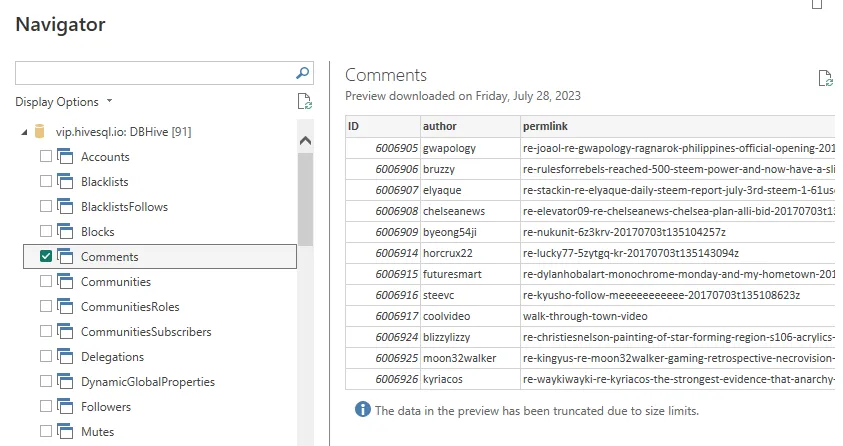
Select only what you need!
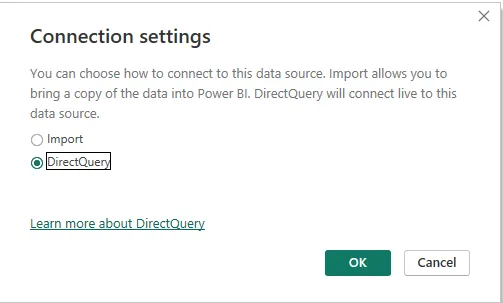
Import will download the whole table onto your computer (you can refresh it later to download more data). Do this if you're going to join with data from other sources.
DirectQuery will dynamically create SQL queries to pass to the database whenever you refresh your reports. Since we're working with only one table and keeping our query concise, that's what we'll use.
If your reports take longer than a second or two to refresh, switch to Import so that you're not abusing the database. Then you don't have to worry about it.
Building Reports
Once you're connected to HiveSQL using PowerBI, building reports is literally as easy as drag and drop. Seriously! Since I already had a .pbix file saved with my HiveSQL credentials, it took me only a few minutes to build the report I wanted. It took me at least ten times as long to create this guide as it took to build the report in the first place!
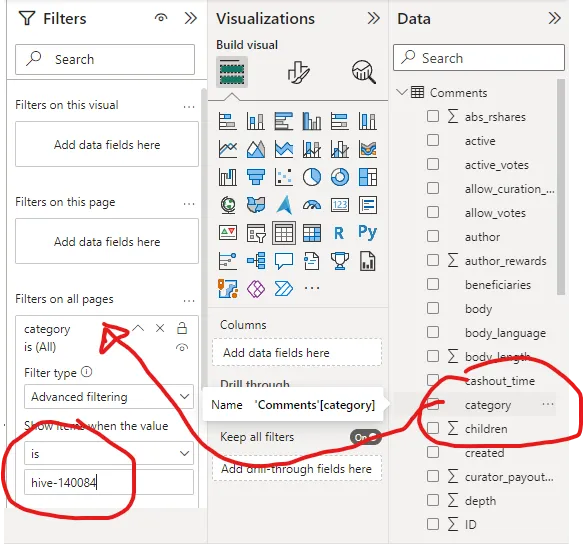
I chose 'Category' as a report-level filter and dropped in the community ID. The documentation tells us that 'Category' is the first tag. When you post in community, it defaults the community ID as the first tag (and you can't change). Comments automatically have the same category as the post they replied on, so this category will include everything that happens within the community page.
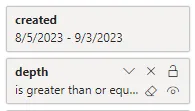
Additional filters are 'created' which is the date the comment was posted, and 'depth' which will identify whether it's a post or a comment.
For 'created' date, I used relative date filters (last 30 days, excluding today) so that it will automatically update the filter range whenever I open the file. You can also use previous # of weeks, months, etc. depending on your requirements. If @freecompliments decides the best usefulness for this data is monthly, then previous 1 month will be a better filter than previous 30 days.
Posts have a depth of 0, and comments have a depth of 1 or greater (top-level comment, response to comment, etc.) I initially filtered this as greater than or equal to 1 (correct!) but when I did a little revision, I forgot there was a zero and updated to it to greater than 1 (incorrect!) so now I've fixed it back.
For the table itself, I chose author, permlink, depth, and body. Depth wasn't needed, but I wanted to demonstrate that I included all the comments, not just top-level. I incorrectly chose parent_permlink the first time (the permlink of the post or comment receiving the reply) and it made it look like some comments were missing.
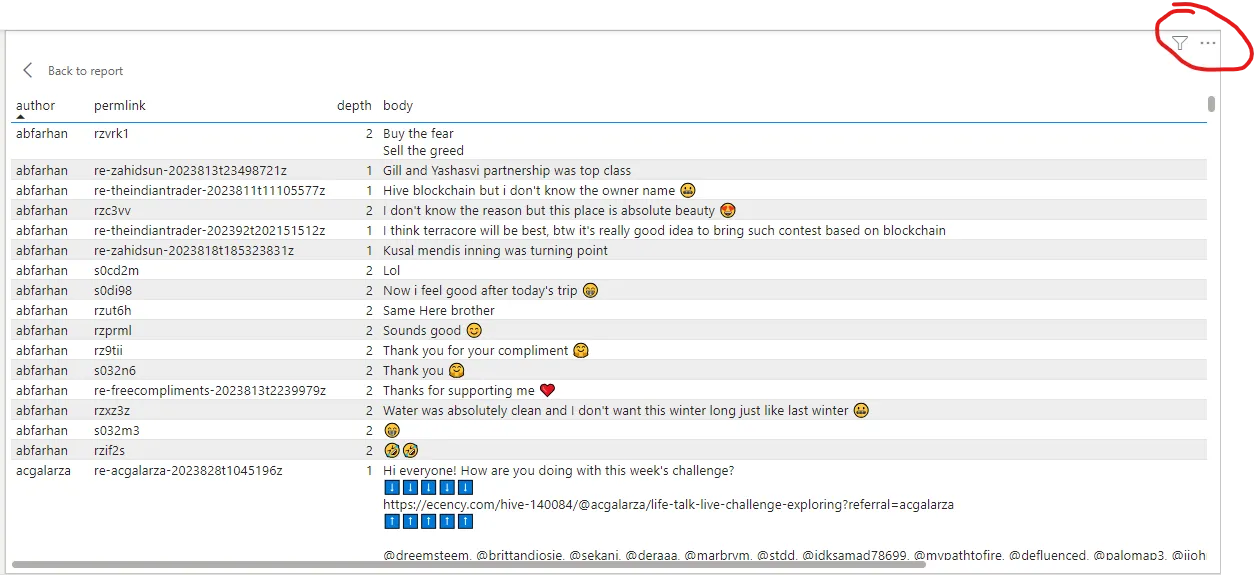
Voila, this table, which can be easily exported into a .csv format and shared via Discord, google sheets, or whatever! You can easily format that into markdown within Excel or Google sheets and drop into a post, too!
Just for kicks, I created a couple more quick visuals that make it easier for me to see what's happening in the data, so my total page looks like this:
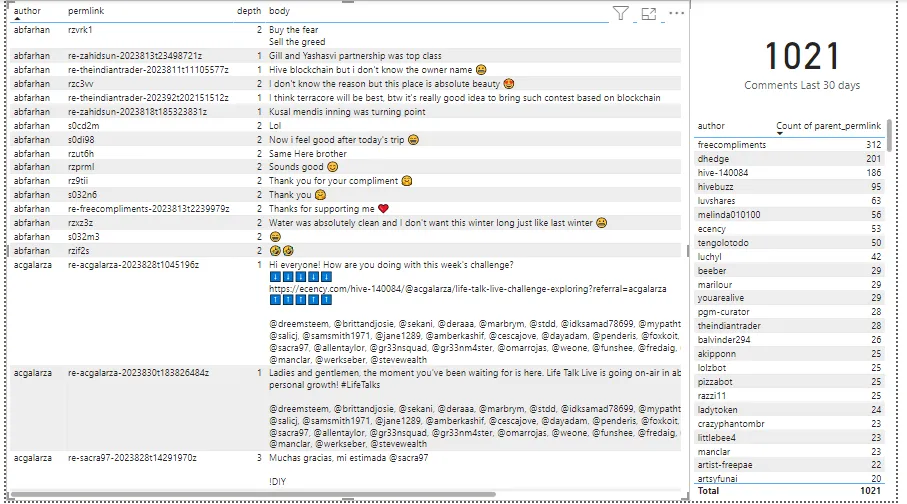
The key advantage to this layout is the descending order by comment count on the right (actually still uses the wrong permlink field in the second visual; I better fix that). I can click on any name and it will automatically filter the left visual to show only their comments. Nice!
Go Forth and Build!!
Now you've seen how easy it is, go build! You've also seen how easy it is to make mistakes, but that just means it's fast to iterate. Collect requirements, build something quick, gather feedback, iterate! Working with data is fun and easy when you have the right tools.