How is the second layer solution on Hive doing during these times? Is more Hive deposited or withdrawn from it. Let’s take a look.

Image background generated with Midjoureny
Hive Engine is now almost an OG when it comes to Hive and L2. It has been around since 2019, four years now, and has enabled a lot of projects building on top of Hive. While not perfect, its existence has been a very important tool in the Hive ecosystem.
Splinterlands and its tokens and pools are the main ones that drive most of the volume on Hive Engine but there are a lot of other apps. Gaming tokens seem to be growing more and more these days.
Here we will be looking at the volume that Hive Engine does in terms of deposits and withdrawals on the platform. It is a nice indicator of the state of the platform.
At the moment there are three major gateways for deposits and withdrawals on Hive Engine:
- Hive Engine (@honey-swap)
- BeeSwap (@hiveswap)
- Kswap/uswap
- LeoDex (@leodex)
The fee for deposits and withdrawals on Hive Engine is 0.75%, while on Beeswap is 0.45%, but at time you get rewards in form of BXT tokens, depending on the liquidity, so this fee is lower even more. The kswap/uswap app has the lowest fee and it can even give you HIVE rewards, but also depends on the liquidity.
Deposits
For deposits we will be looking at the transfers to the Hive Engine: @honey-swap account, @leodex, @hiveswap, @kswap and @uswap.
Here is the chart.
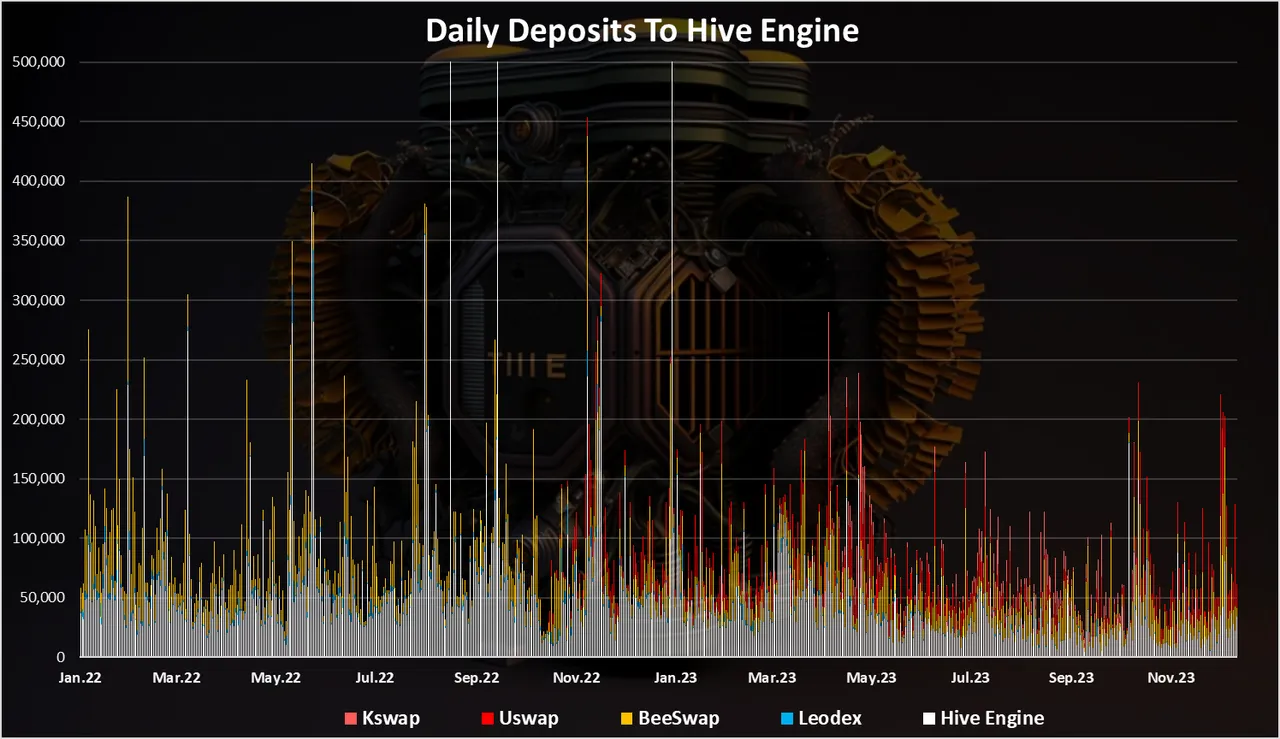
The daily chart is a bit messy with a lot of spikes and ups and downs.
Overall, it seems that the volume has been quite steady with a slow downtrend in 2023. On average around 70k HIVE deposited daily in the last period.
Withdrawals
Next the withdrawals. Here is the chart for the daily withdrawals.
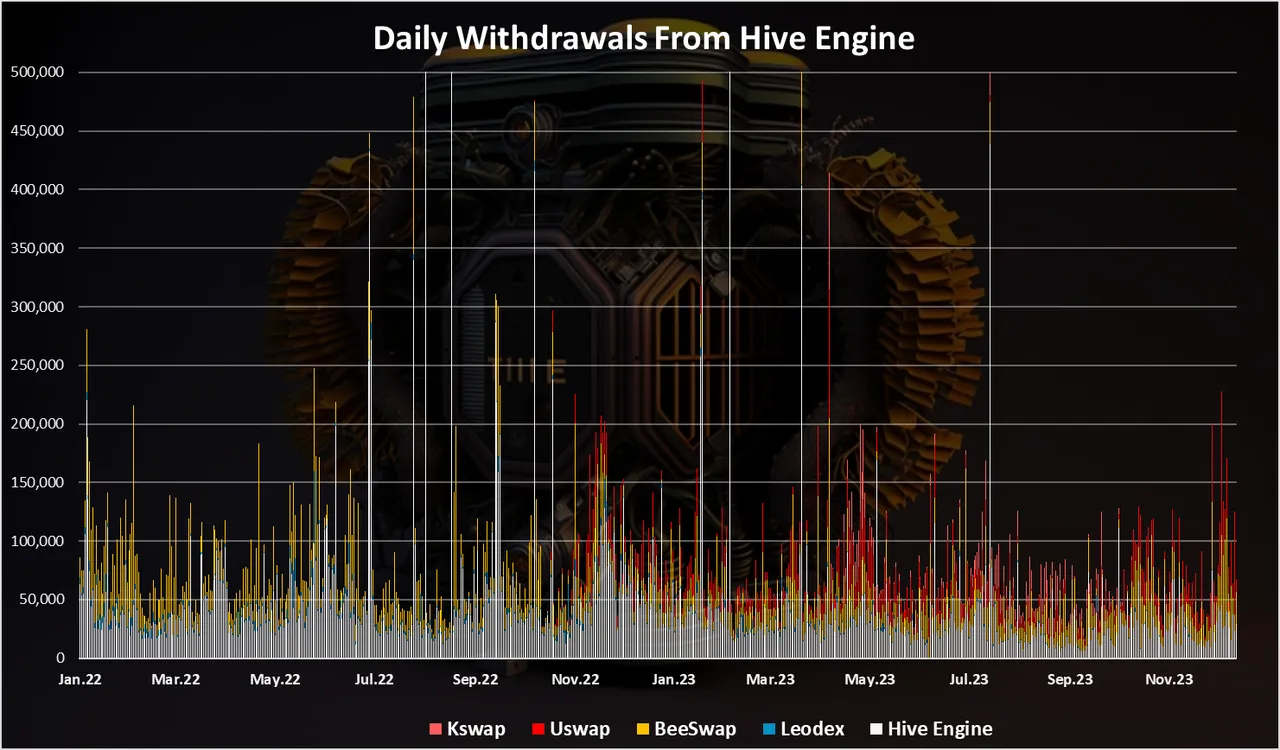
On the withdrawal side we can notice a bit more volatility but still the numbers are around 70k HIVE daily, and some spikes here and there.
Total Volume Per Month
If we take both the deposits and withdrawals and sum them up on a monthly level, we get this.
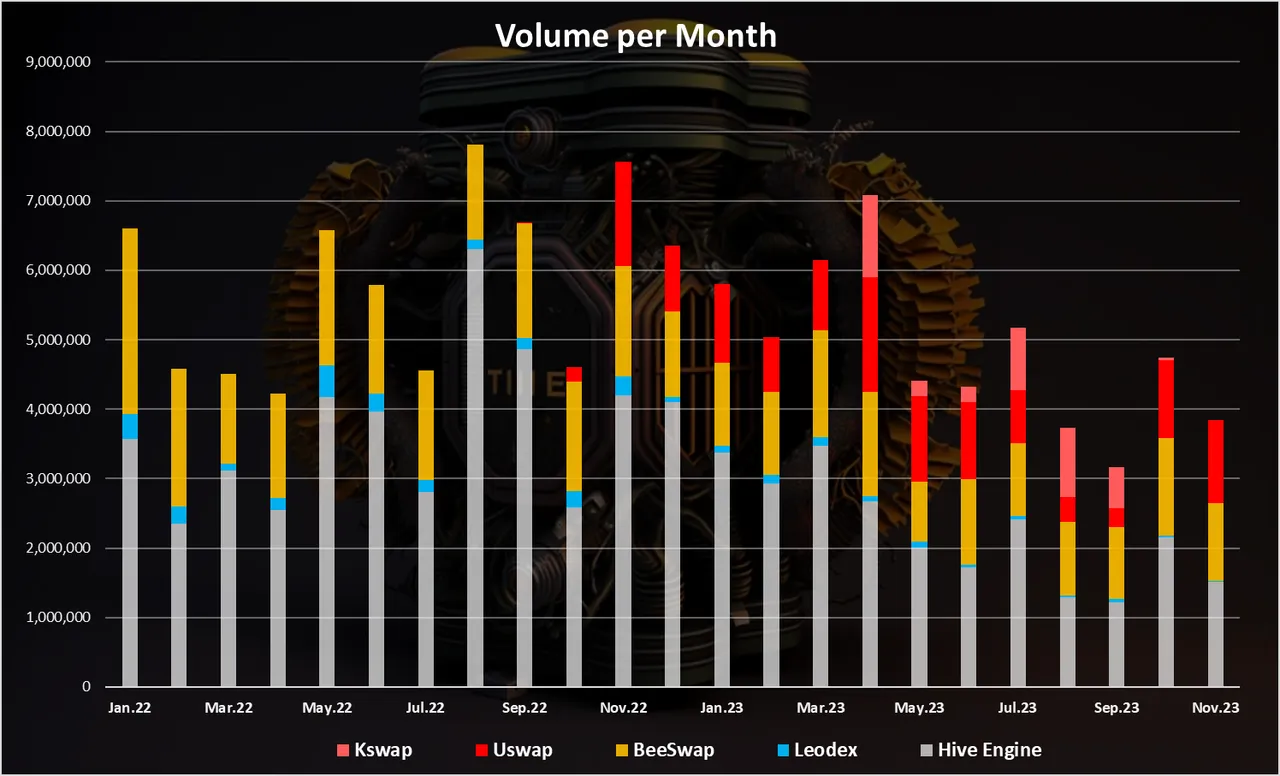
This is a bit clearer representation.
We can notice the downtrend in 2023, but in the last months there seems to be a reversal. Almost 4M HIVE in deposits and withdrawals in November, while in October this number was close to 5M.
We can also notice that the official Hive Engine account, the BeeSwap account and Uswap are making most of the volume, while LEO the leodex is almost nonexistent.
Individual Platforms Share
Here is the chart for the share of the deposits of Hive Engine, BeeSwap, Uswap and Leodex.
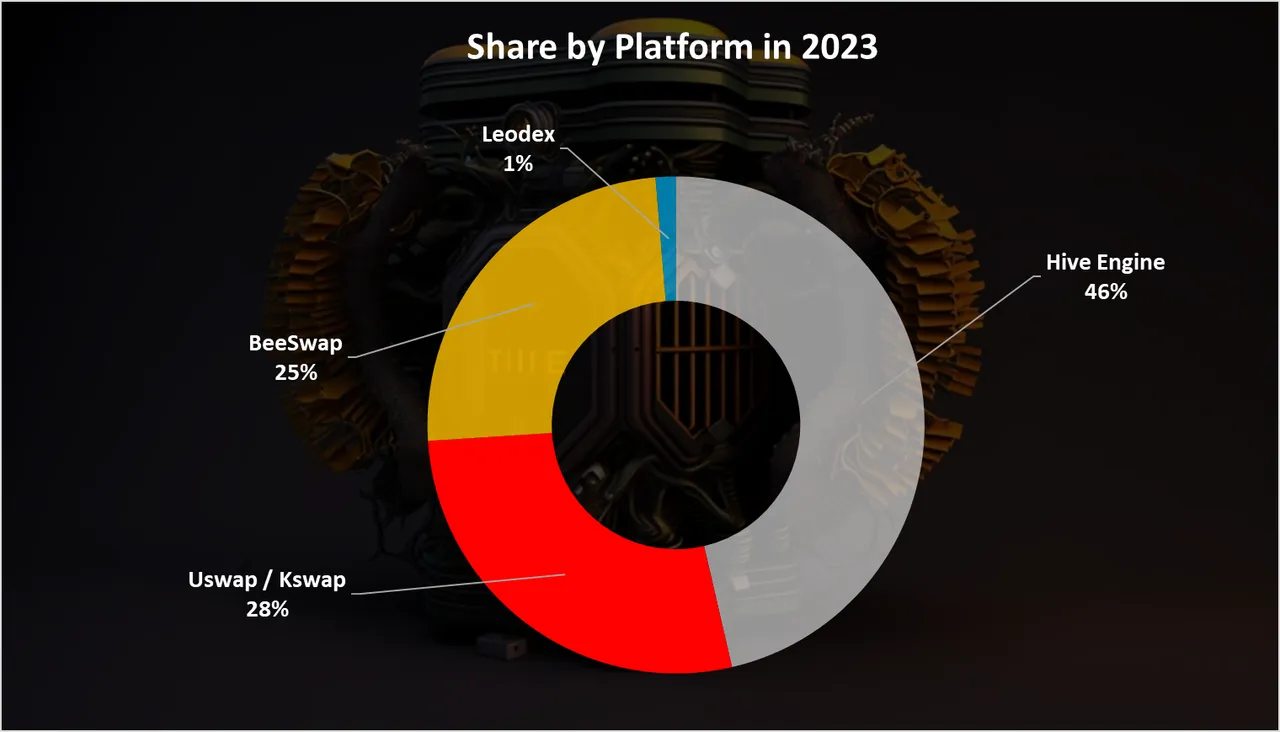
The Hive Engine account @honey-swap has 46% share of the cumulative volume (deposits and withdrawals). Uswap is now in the second spot with 28%, while BeeSwap is on the third spot with 25%.
The official account still holds the majority share, but with under 50%. Uswap and Beeswap hold the other half.
HIVE Supply on Hive Engine
Here is the chart for the HIVE stored on Hive Engine.
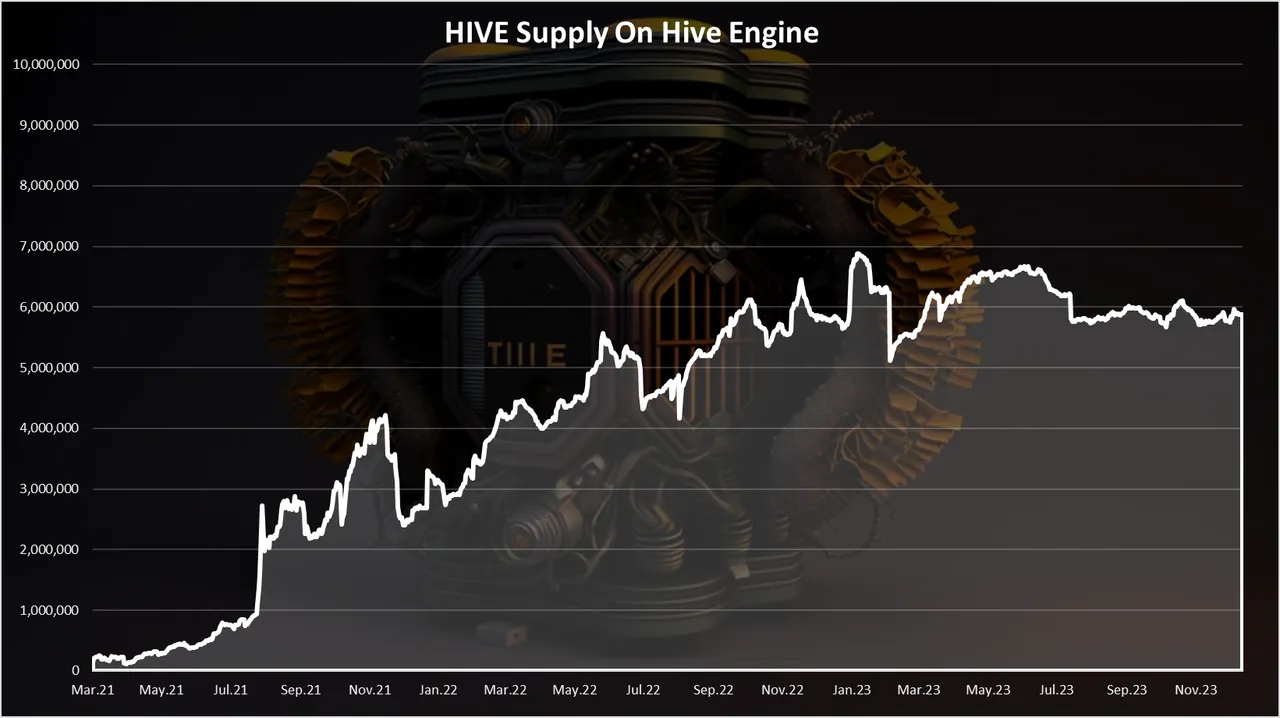
As we can see prior to June 2021 there was under 500k HIVE deposited on Hive Engine. Then it started to grow and with a few dips on the way, it has grown almost constantly to almost 7M at the end of 2022. There was a sharp drop in January 2023, a slow growth again up until May, and a small drop again just recently in July 2023. Since then, the supply on Hive Engine has remained sideways.
A total of 5.8M HIVE now on Engine.
With this growth Hive Engine is now positioning itself as one of the major places for HIVE liquidity and it is number three exchange for HIVE, just after Upbit and Binance.
Top Pools
Here are the top pools:
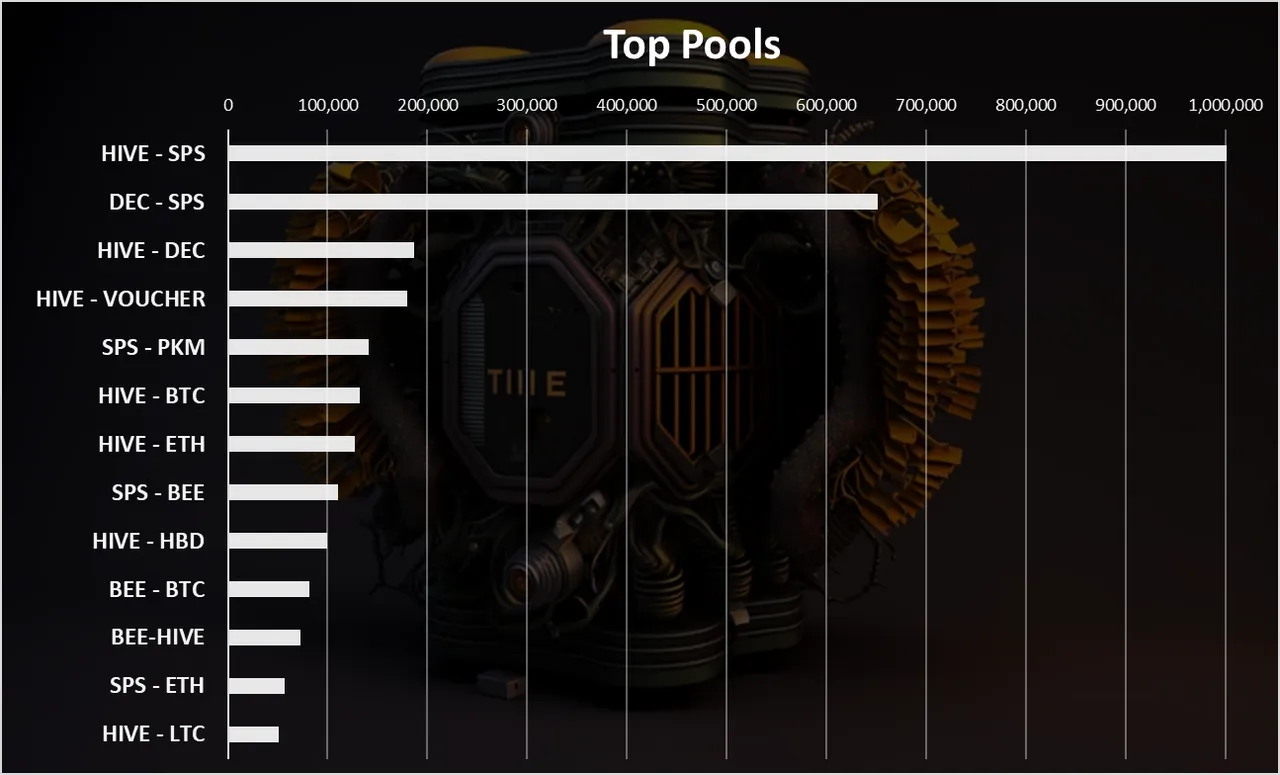
As we can see the top four pools are all Splinterlands related, then come the HIVE-BTC and HIVE-ETH pools. Some more pools in the top like the BEE token and LTC.
In terms of TVL in pools Hive Engine has been around 4M for a while now.
Monthly Number of Accounts Making Deposits or Withdrawals
This can be seen as the number of users on HE, but limited only to deposits and withdrawals on HIVE. Accounts making only swaps and inner token transactions are not included.
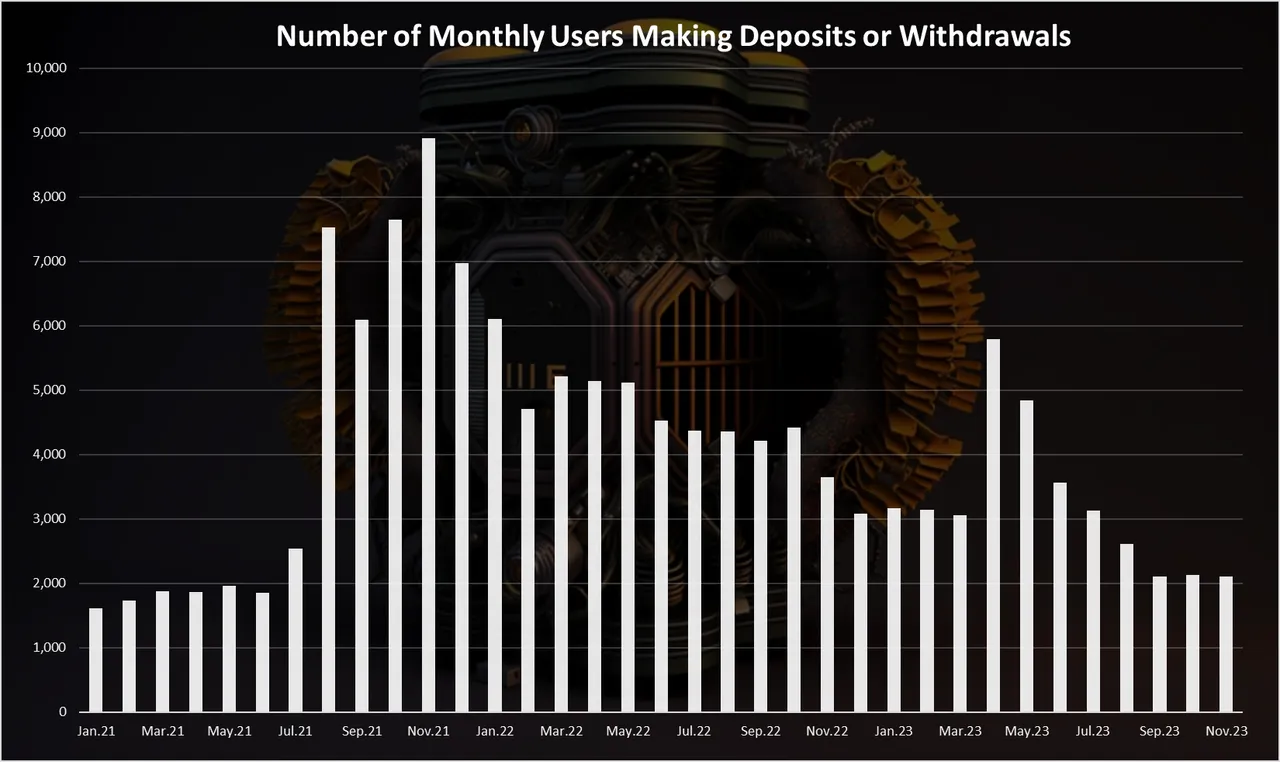
The ATH for number of accounts making deposits and withdrawals was reached back in November 2021 with 9k accounts making transfers. Since then there was constant decline with a spike in April 2023, and a drop since then to just above 2k accounts in the last few months.
Top Accounts that Deposited
Here is the chart for the top accounts that deposited in 2023.
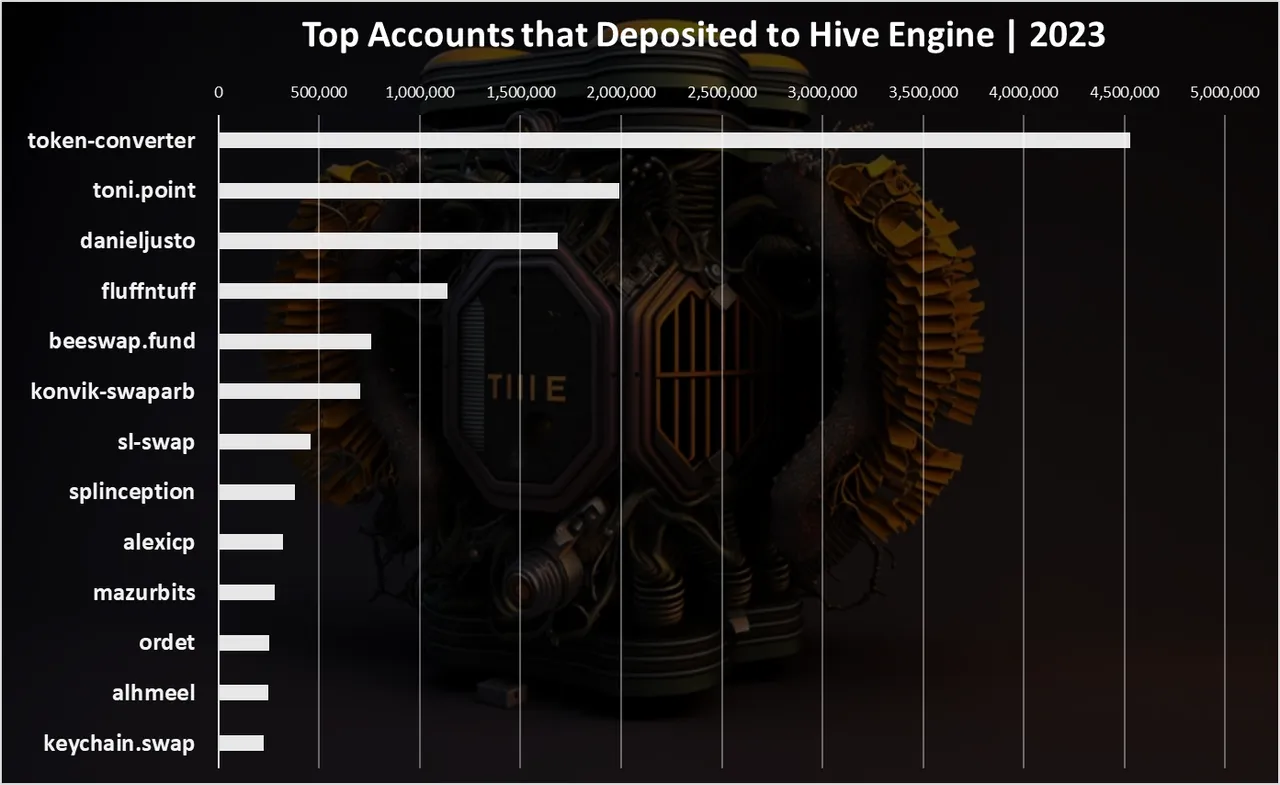
The @token-converter account is on the top with more than 4.5M HIVE deposited in the period. This is an account that is connected with Splinterlands and their inner workings.
The @toni.point on the second spot with more than 2M HIVE, taking care of arbitrage 😊.
Note that these are not net deposits.
Top Accounts that Withdraw
Here is the chart for the top accounts that withdrew in the period.
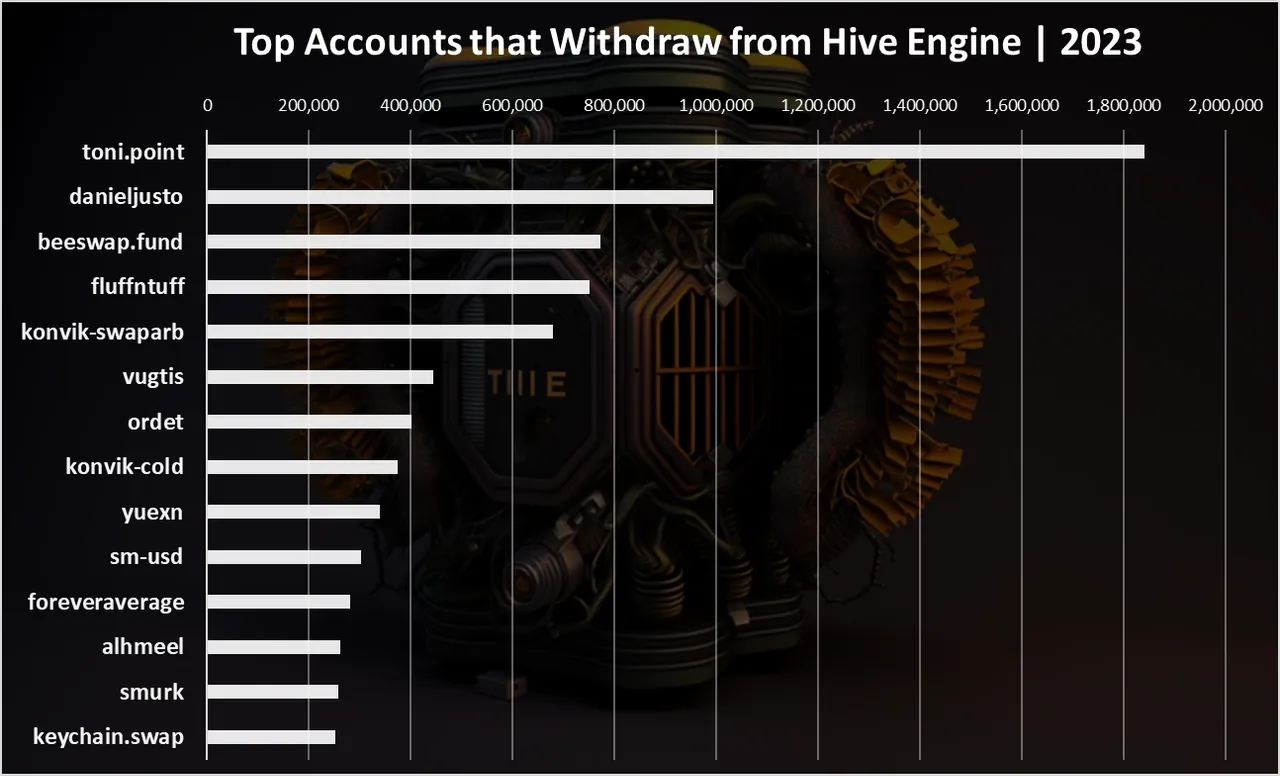
@toni.point is on the top with 1.85M HIVE withdrawn in the period, making arbitrages. The @danieljusto account follows closely with 1M HIVE.
HBD
What about HBD? HBD has been growing in adoption recently. How is the volume for HBD?
Here is the monthly chart.
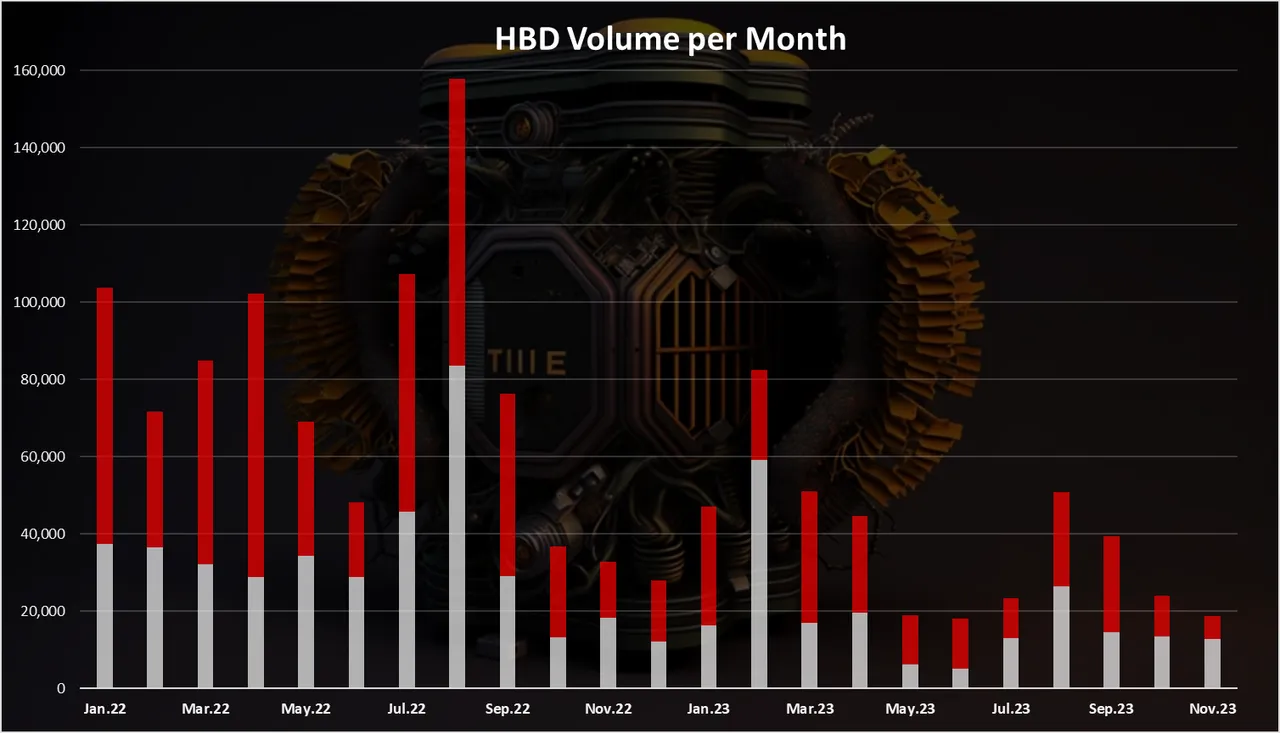
Some ups and downs in the period with ATH were reached in August 2022 with a total volume of 160k HBD.
In the last months the HBD volume on Hive Engine is low, with around 20k HBD monthly.
There are few HBD pairs on Hive Engine with a decent liquidity like the HIVE:HBD and BEE:HBD.
All the best
@dalz