The supply of a token on exchanges is a parameter that is usually closely monitored. The top coins, Bitcoin, Ethereum are especially closely monitored when it comes to the supply on exchanges. What about HIVE?
What is the share of the HIVE supply held on exchanges? What is the trend is it going up or down? How has deposited/withdraw the most? Let’s take a look!
Here we will be looking at the following:
- Daily deposits to exchanges
- Daily withdrawals from exchanges
- Net deposits VS withdrawals
- HIVE balance on exchanges
- Top accounts that deposited to exchanges
- Top accounts that withdraw from exchanges
- Top exchanges balance
Exchanges taken in the analysis: Upbit, Binance, Bithumb, Bittrex, Hive Engine, Huobi, Gate.io, Probit, Ionomy, MEXC, and Indodax. There are few more exchanges but the volume there is quite low.
Deposits to Exchanges
Here is the chart for the daily transfers/deposits to exchanges.
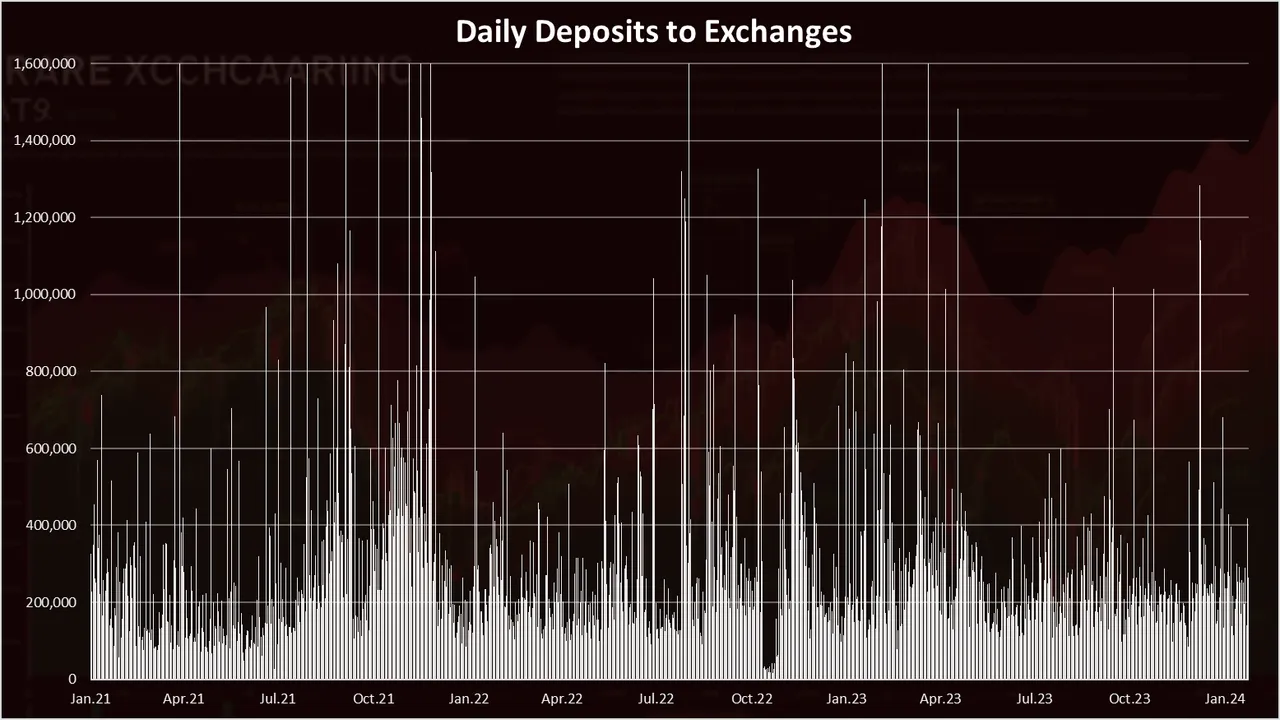
Note: Transfers between exchanges accounts are excluded from the data above.
We can notice some spikes in the data above. There seems to be more volatility in the past especially in 2021, and then some uptrend in January 2023 again.
On average there is 270k HIVE deposited daily. Note these are not net deposits. For that we need to look at the daily withdrawals as well.
Withdrawals from Exchanges
The chart for the daily withdrawals looks like this.
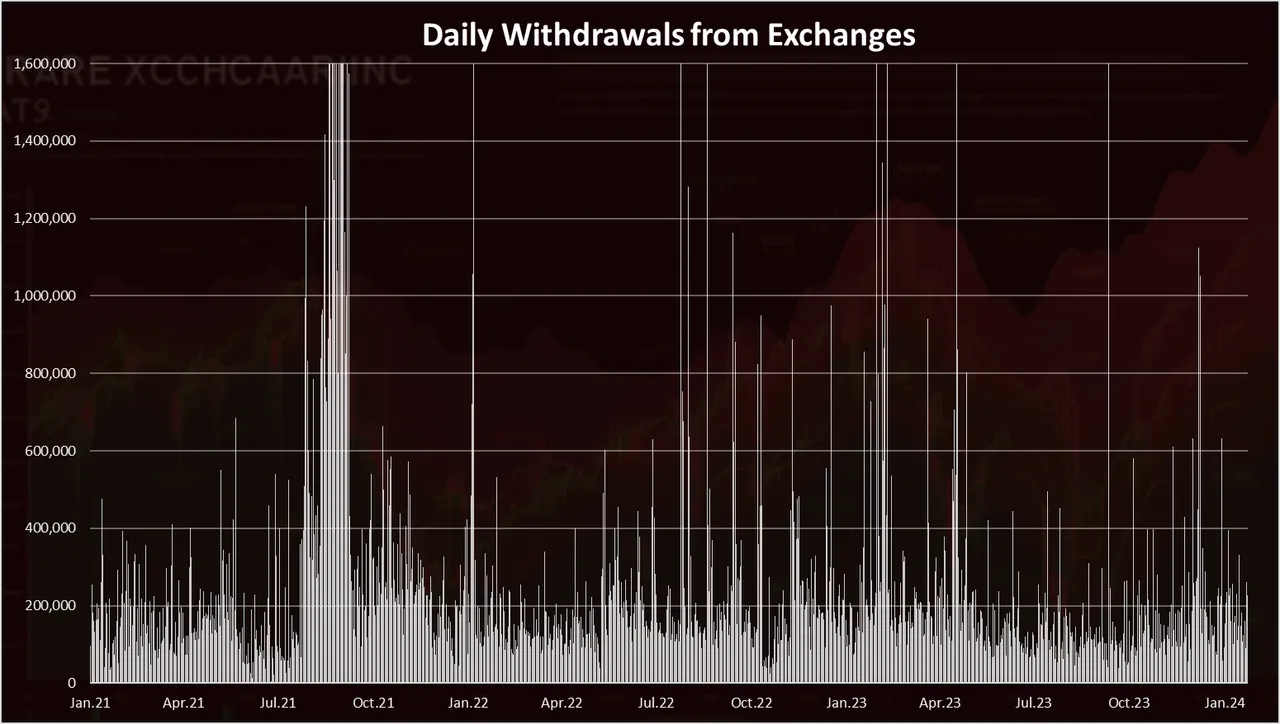
As for the above, here as well the transfers between exchanges accounts are excluded.
We can see the strong moves here back in August 2021 as well, and some spikes since then. On average in 2023 there is 200k daily HIVE withdrawn from exchanges.
Net Daily Deposits
When we add the deposits and withdrawals on a daily basis the chart looks like this.
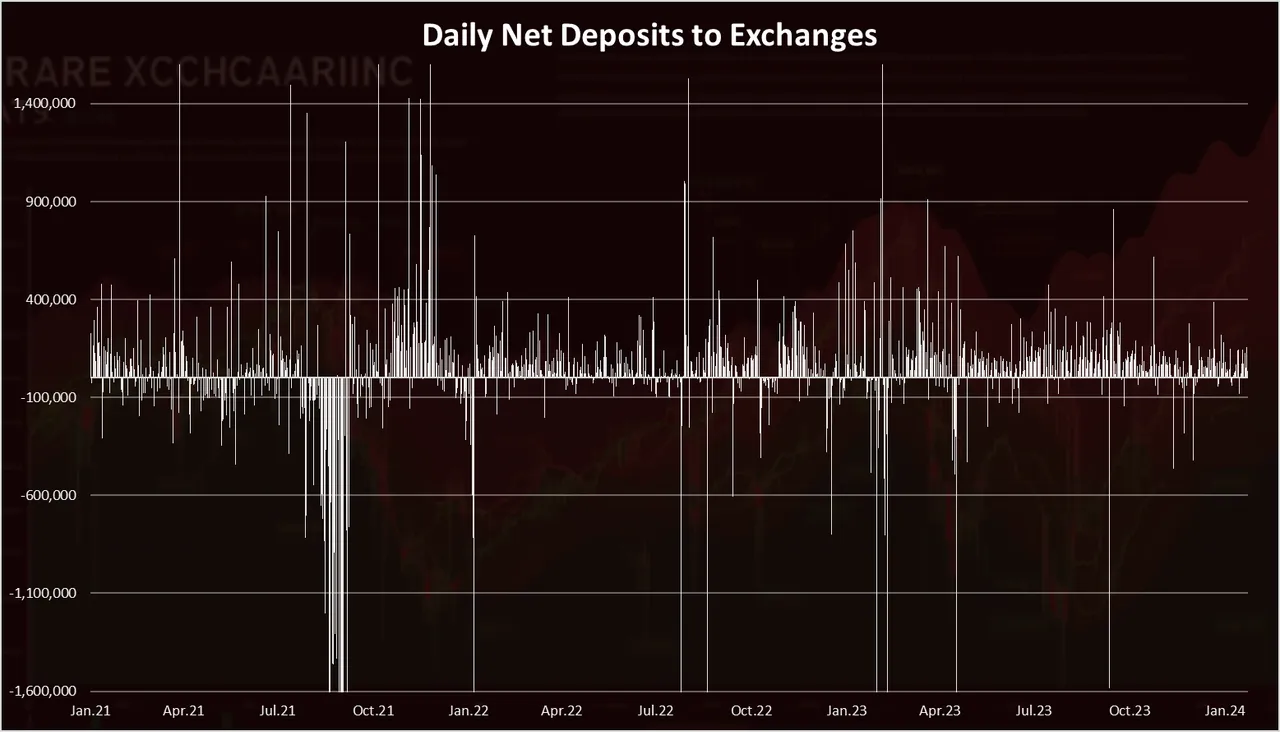
The most noticeable moves here as well are back in 2021, when first there was a lot of withdrawals and then deposits to exchange. Since then, we ca see some spikes up and down, but much smaller moves.
Monthly Net Deposits VS Withdrawals
When we add the deposits and withdrawals on a monthly basis the chart looks like this.
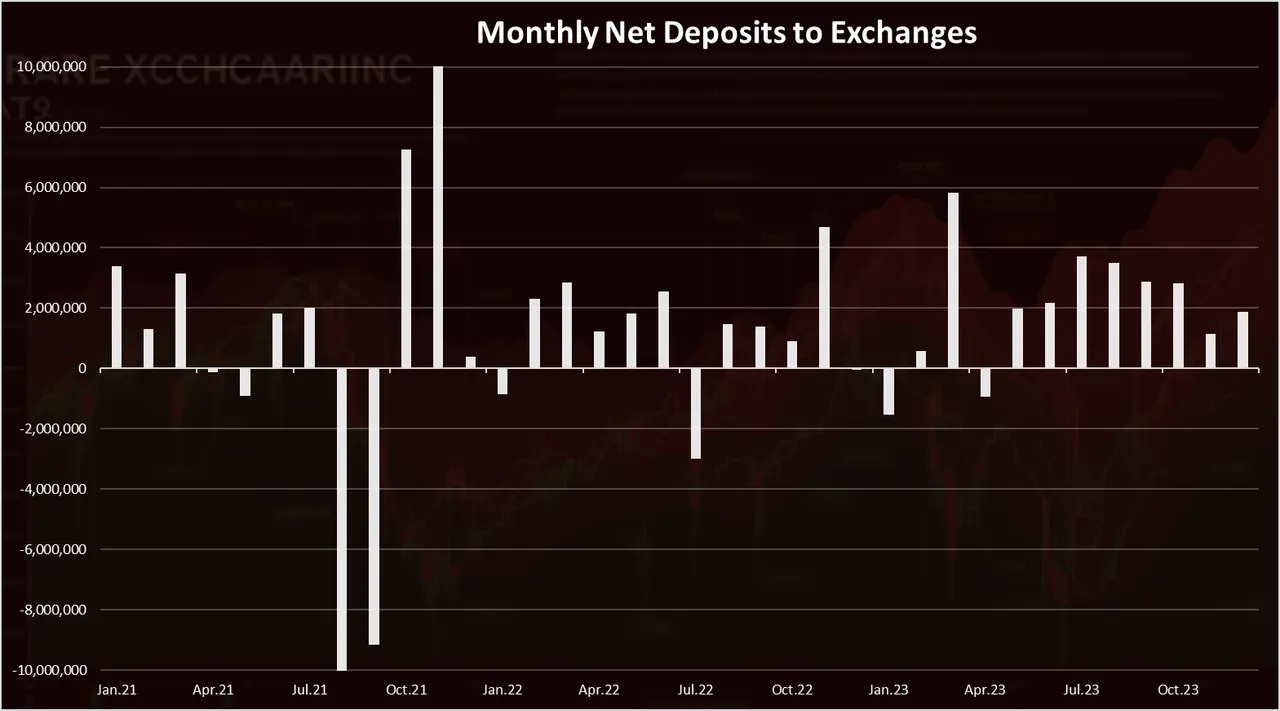
A clearer representation here.
Again, the volatility back from 2021 is noticeable here as well. This is because of the HBD movements at the time, when HBD increased to above its peg, and a lot of HIVE was withdrawn from exchanges and converted to HBD.
When we zoom in 2023 we get this:
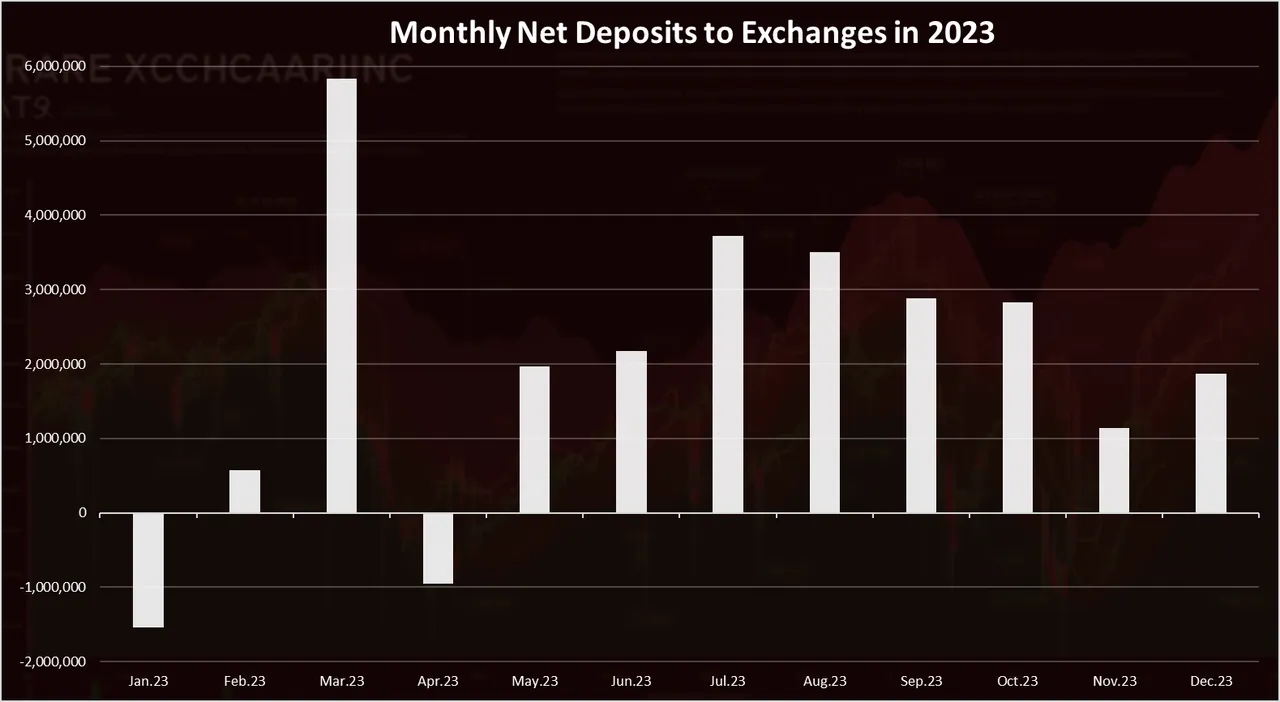
In 2023, the year started with January having more HIVE withdrawn from exchanges then deposited, a total of -1.5M HIVE, then a small increase in February, a jump in March to 6M, a drop again in April and a positive net deposit in the last months around 2M monthly.
In summary a total of 24M net HIVE was transferred to exchanges in 2023.
Top Accounts that Deposited to Exchanges in the Last 30 Days
Who has transferred the most funds to exchanges? Here is the chart for the last 30 days.
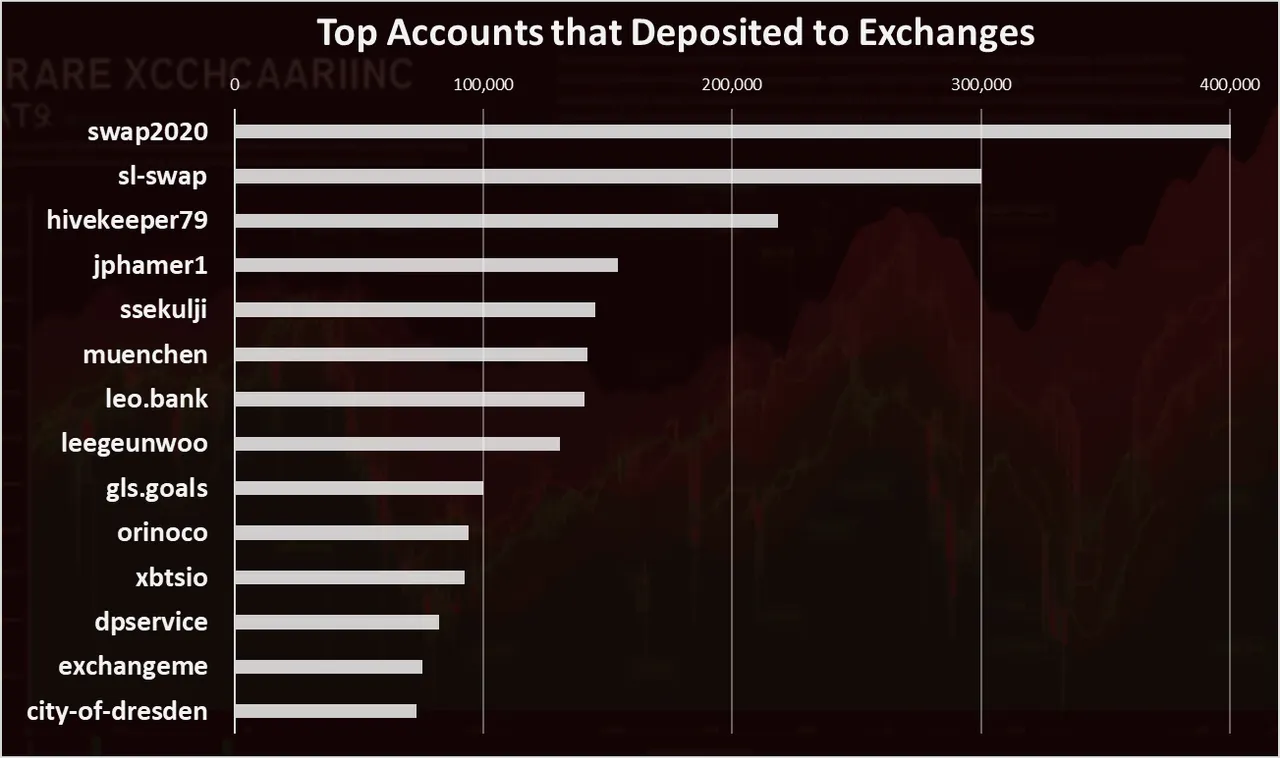
The @swap2020 is on the top here with 400k HIVE deposited to exchanges in the last 30 days, followed by @sl-swap and @hivekeeper79.
Note that this is a net HIVE deposited to exchanges, with both, deposits and withdrawals taken into account.
Top Accounts that Withdrawn from Exchanges in the Last 30 Days
Who has withdrawn the most funds from exchanges? Here is the chart for the year.
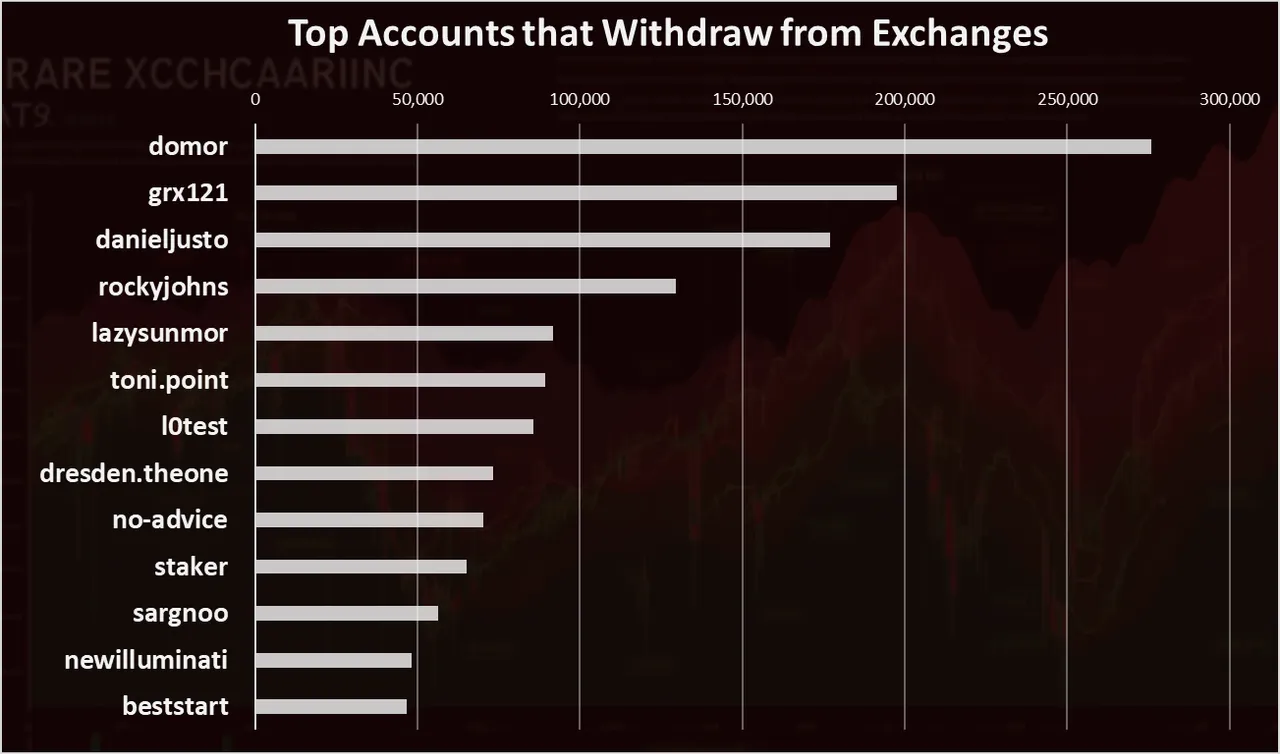
The @domor account is on the top here with almost 275k withdrawn from exchanges in the last 30 days, followed by @grx121 and @danieljusto.
HIVE Balance on Exchanges
What is the amount of HIVE on exchanges?
Here is the chart.
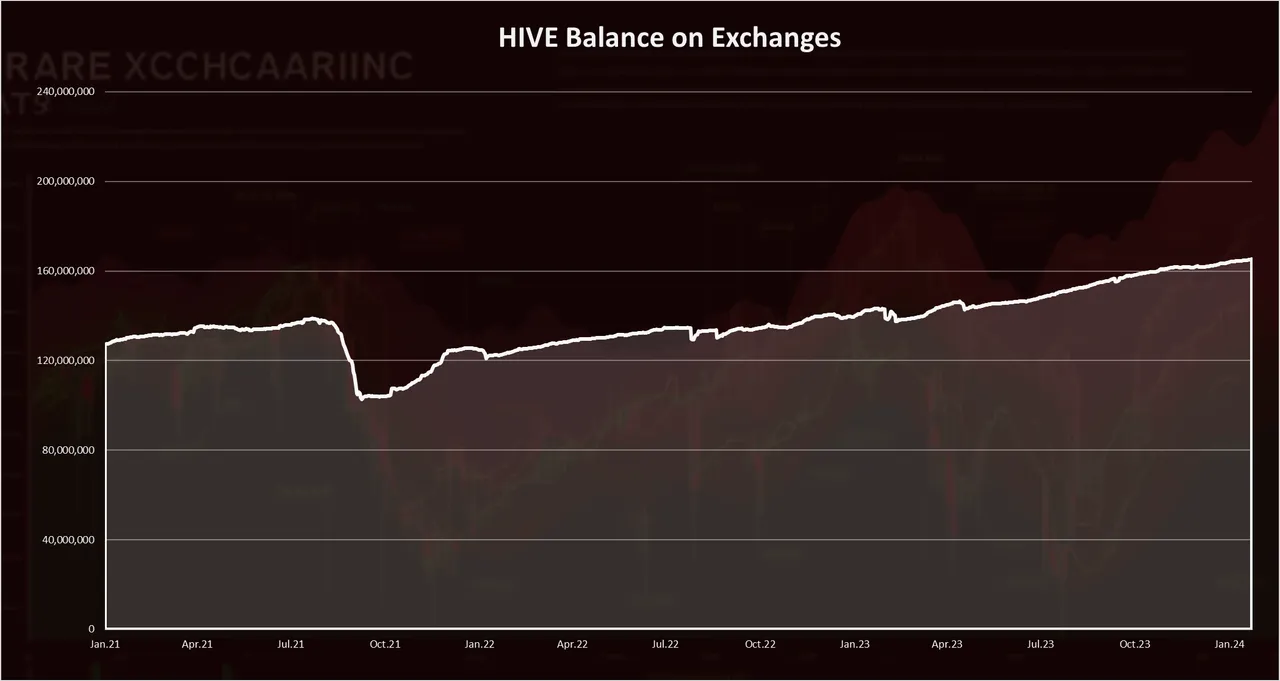
As we can see the overall HIVE balance on exchanges has been growing, with some dips along the way. Recently there were small dips in April and one more in February 2023.
In 2023 at the start there was 140M HIVE on exchanges and at the end of 2023 there is 165M. A 25M more HIVE added to exchanges in 2023. This is a record year for HIVE added on exchanges. Back in 2022 there was around 15M, while 2021 was negative.
When we plot the balance on the exchanges against the total HIVE supply, we get this.
HIVE share on exchanges:
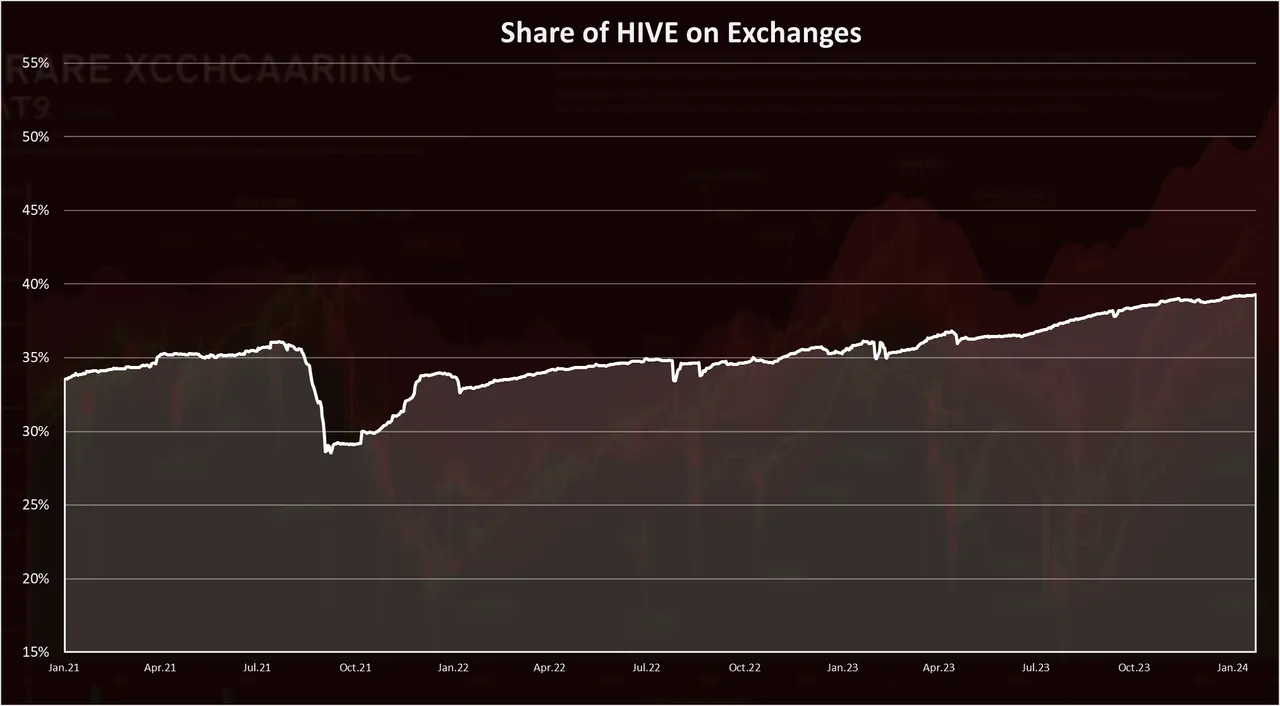
From the chart above we can say that the HIVE balance on exchanges has been growing both in absolute and in relative terms.
There was some oscillation in 2023, a drop back in February, a steady increase in March, a drop again in April and somewhat a steady share in May 2023.
At the begging of 2023 there was 35% of the HIVE supply on exchanges and now there is a 39% or a 4% increase. In 2022 there was an increase from 33% to 35%.
The top exchanges that hold HIVE are the following:
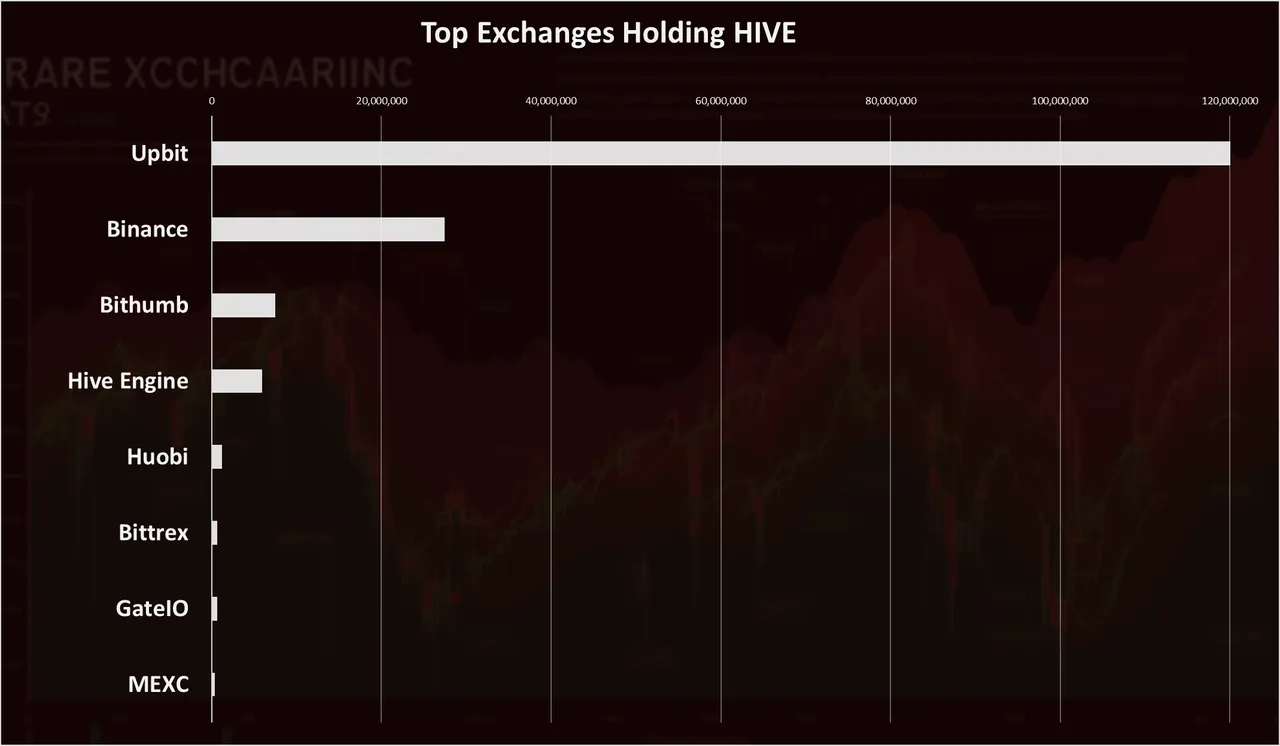
Upbit is absolutely dominant with more than 100M HIVE. On the second spot is Binance with 25M, followed by Bithumb. Bittrex has now almost dropped out from holding HIVE.
Since Upbit is dominating HIVE on exchanges here is the chart for HIVE there.
HIVE on Upbit:
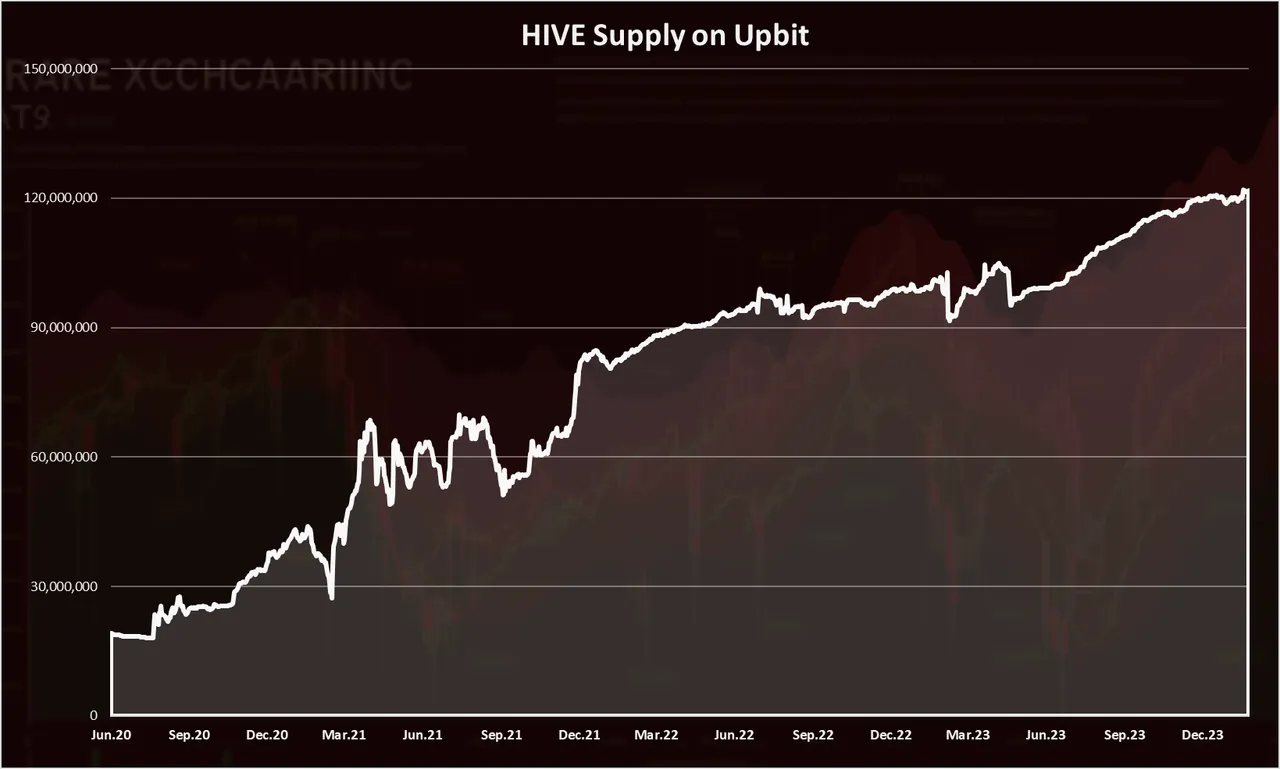
There is now 121M HIVE on Upbit now or 29% of the HIVE supply. The amount of HIVE on Upbit stated with around 20M back in 2020 when the hardfork happened. Since then it has been growing constantly, more aggressively in 2021, then some slowdown in 2022, and more aggressively in the second half of 2023 again.
All the best
@dalz