If the Hive supply wasn’t already confusing enough with the regular supply, virtual supply, conversions etc, here is another term for it.
Available HIVE supply.
What is it and how it is different than the regular HIVE supply? Is it inflating at the same rate or faster than the regular supply?
Let’s take a look.
As already mentioned, there is the regular HIVE supply and the virtual HIVE supply.
The regular HIVE supply is the simplest data, and it represents the amount of HIVE tokens in existence. It is shown on most of the hive block explorers. At the moment this number is around 424M.
The virtual HIVE supply has also been around for a long time. It is connected to the supply of the stablecoin, HBD. It represents the amount of HIVE in circulation and on top of it, the theoretical HIVE that can be created from HBD conversions at the current feed price. Because this number is in correlation to the HIVE price, it can vary a lot. At the moment the virtual HIVE supply is at 510M.
The available HIVE supply is a result from the Hive HardFork, back in March 2020, when around 83M HIVE was put in the DHF/DAO. The DHF by design doesn’t hold HIVE, but HBD. But bearing in mind the extraordinary circumstances that lead to the HardFork, most of the prior company tokens, the so-called ninja mine were transferred to the DHF. This HIVE is put in slow mode conversions, where 0.05% a day is converted to HBD, that can be used by the DHF to pay for development and proposals. The HIVE in the DHF is locked and can’t be used for proposals and can’t leave the DHF.
When we remove the HIVE balance in the DHF, from the regular HIVE supply we get the available HIVE supply. At the moment there is around 44M HIVE in the DHF, so the available HIVE supply is 424 – 44 = 380M.
Now that we have defined what is what, let’s take a look at the historical data.
HIVE Supply Breakdown
The regular and the virtual HIVE supply, for which I’m making regular monthly reports, is presented in the following chart.
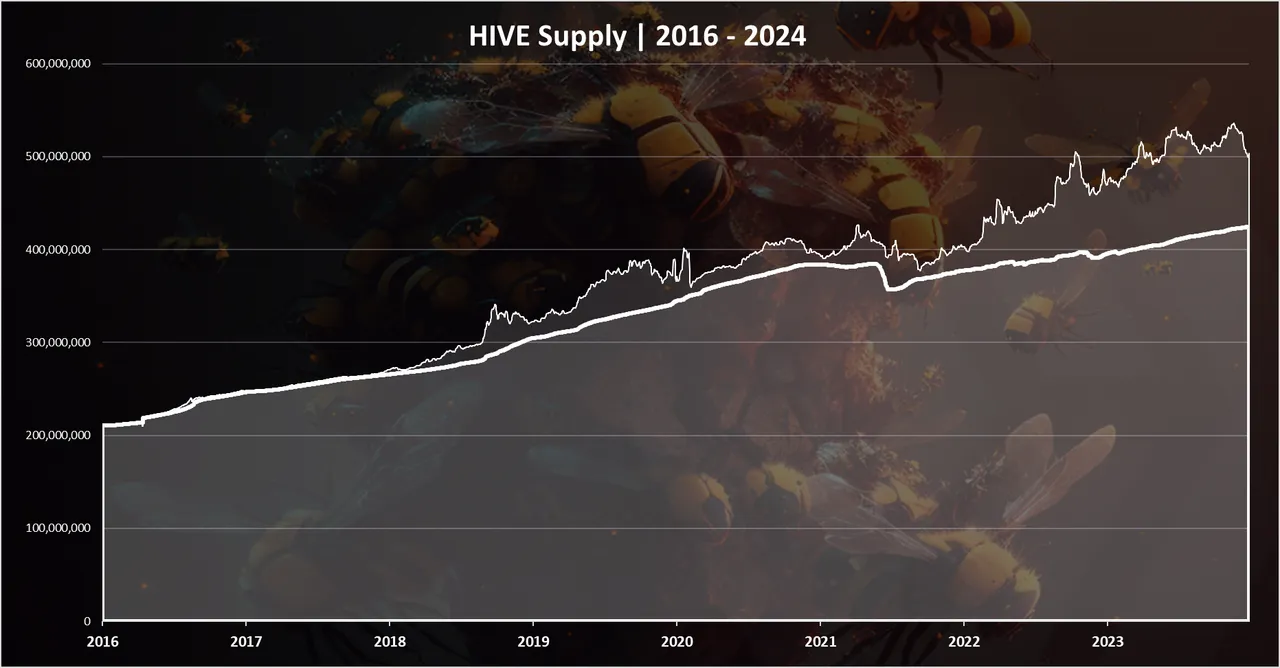
The light color on the top is the virtual HIVE supply, while the bold line is the regular HIVE supply. As mentioned, the virtual HIVE supply is in correlation of the HBD supply and the price of HIVE and can vary a lot. Additionally, the virtual HIVE supply included the HBD in the DHF, that is locked. As the HBD balance in the DHF grows so does the virtual HIVE supply.
HIVE Balance in the DHF
As mentioned, 83M HIVE were transferred from the Steemit accounts into the DHF with the Hive HardFork back in March 2020. Later in October 2020 with another HardFork these funds were put in slow conversion at a rate of 0.05% per day. The long timeframe for conversions was initially set to avoid price volatility.
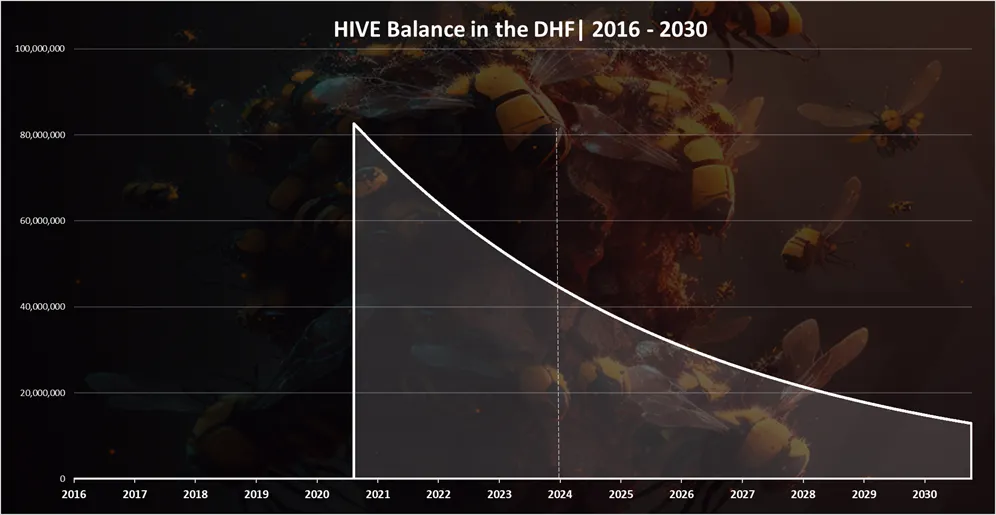
The dotted line is the current date.
As we can see from the chart above the HIVE balance in the DHF has been going down, and from the initial 83M, there is now 44M HIVE. Almost 50% of the initial balance has now been converted to HBD in the DHF.
As shown in the chart, at this pace, the conversions will continue till 2030, and beyond. In 2030 there will still be around 12M in the DHF, if it is not changed with another HF. The impact on the overall tokenomics from this balance at that time will be low. Even today, almost four years from the start of the HIVE to HBD conversions in the DHF, the impact of this balance has been reduced.
As far as I understand the initial idea was for these tokens to be converted to HBD in a period of five years. But obviously the way they are set up, as a percent of the current balance, the conversions keep on for much longer. The daily amount of absolute tokens converted is a function of the HIVE balance in the DHF, and keeps going down as the HIVE balance is reduced. For example, when there was 83M, around 41k HIVE were converted to HBD daily, while now this number is around 22k HIVE per day.
On a yearly basis, in the first year, around 13M HIVE was converted to HBD in 2021, then 11M in 2022, 9M in 2023, and in 2024 it is expected around 7.7M HIVE to be converted to HBD in the DHF.
Available HIVE Supply
When we add the breakdown for the HIVE balance in the DHF we get this chart.
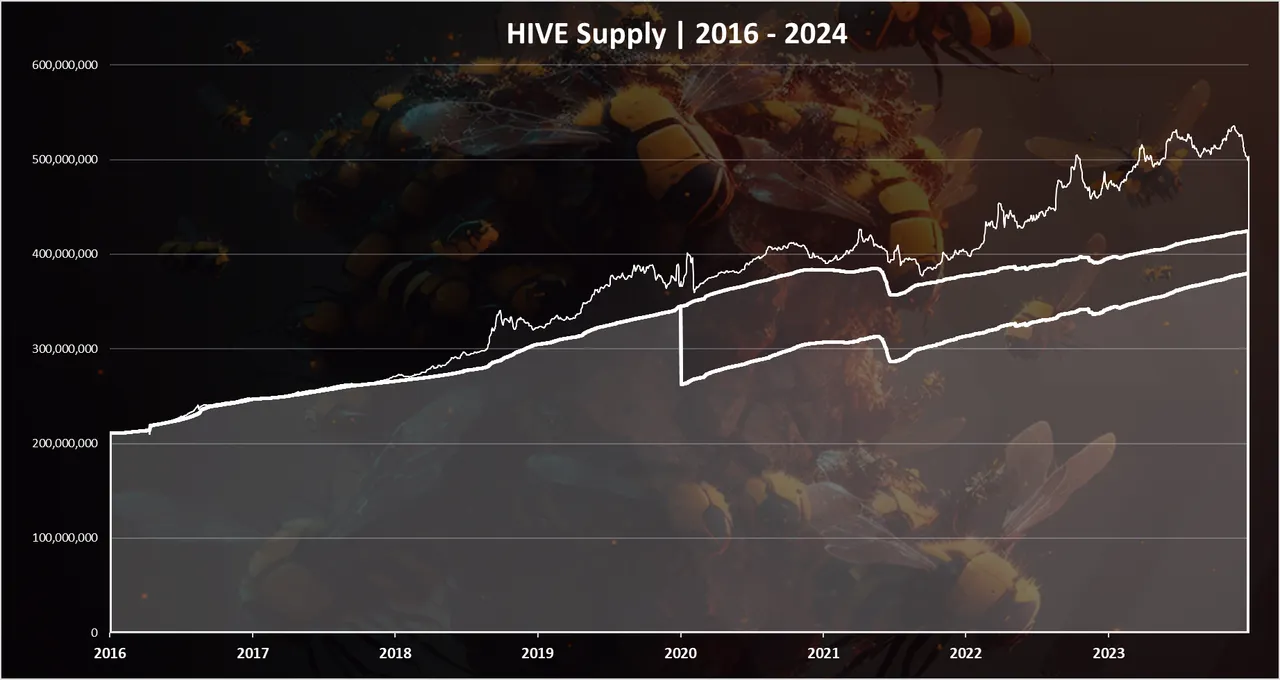
Available, regular and virtual HIVE supply.
The available HIVE supply is the lowest line on the chart.
We can notice the sharp drop in the available HIVE supply in 2020, when the Hive HF happened, and the tokens were moved to the DHF. Since then, the amount of these tokens has been going down, and the two lines are slowly converging to each other, slowly closing the gap.
This process will continue in the years to come.
The available HIVE only chart looks like this.
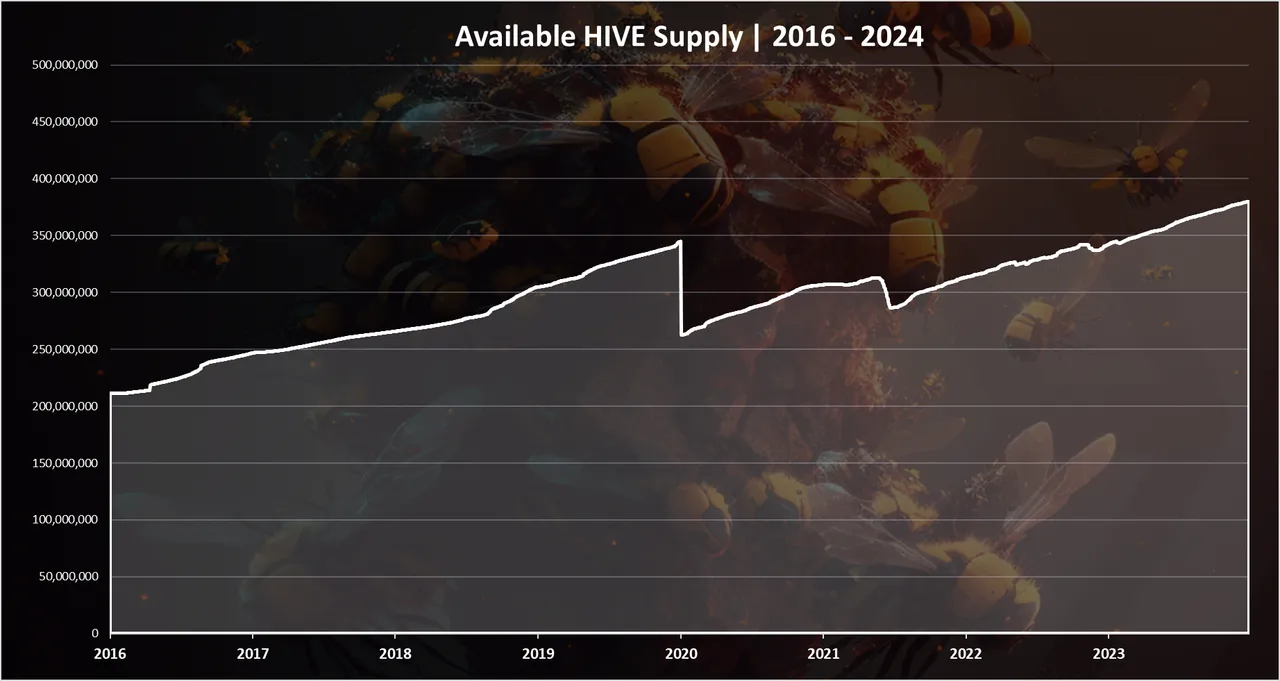
Here we can see a clearer representation of the available HIVE supply. After the drop in 2020 and the transfer of the HIVE to the DHF, the available HIVE supply has been growing and it has now surpassed the 350M mark where it was in 2020. We now have 380M available HIVE. Out of this 173M HIVE is powered up, accounting for 207M liquid HIVE.
The chart for the current HIVE token allocation looks like this:
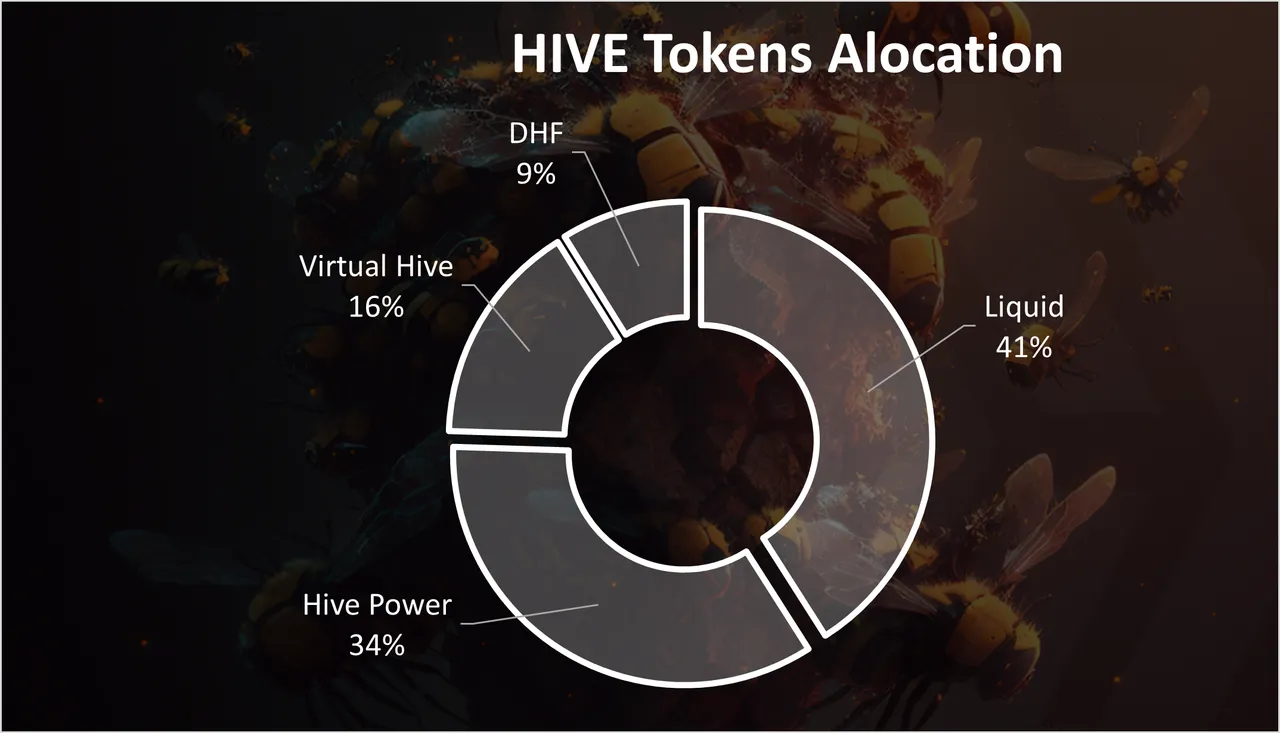
Out of the 510M HIVE total virtual supply, including the potential HBD converted to HIVE, we have 41% liquid share (207M), 34% Hive Power (173M), 16% virtual supply that is volatile depending on the HIVE prices and 9% in the DHF (44M).
Inflation, Regular VS Available
Now that we have extracted the data for the available HIVE supply let’s take a look at the inflation rate for it. Is it inflating differently than the regular HIVE inflation?
First a reminder of the regular HIVE inflation. Here is the long-term chart.
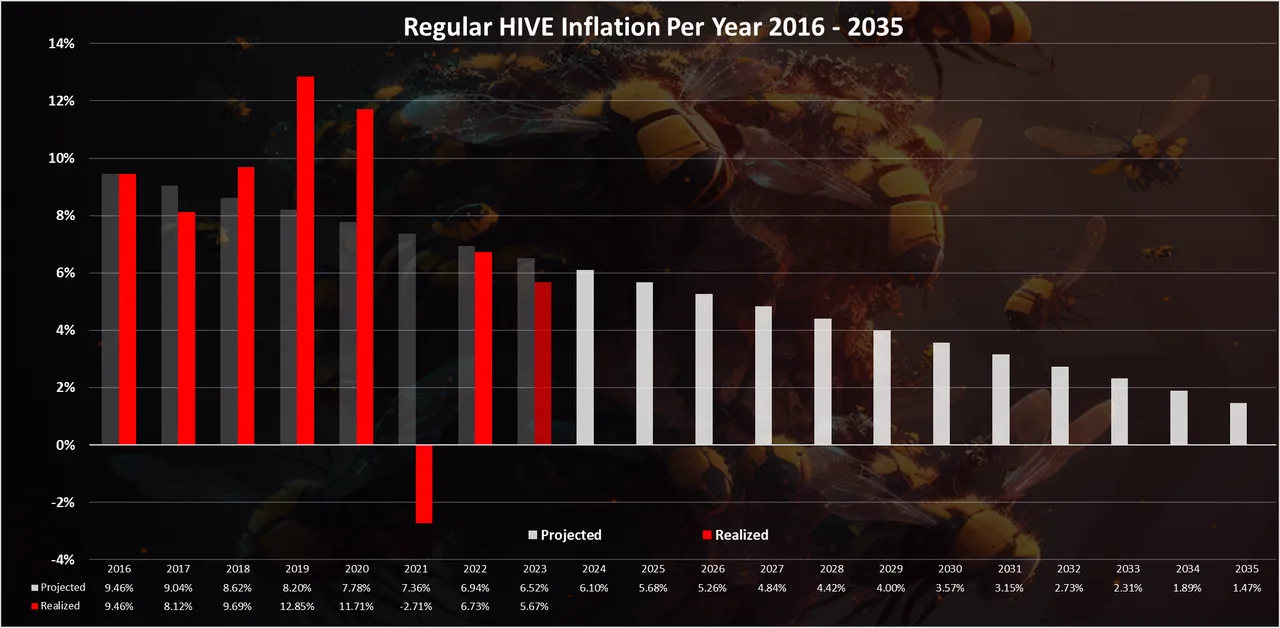
We have the data for the projected and realized inflation here.
Now let’s break down the data for the regular and available HIVE inflation.
HIVE Added per Year, Regular and Available | 2016 - 2023
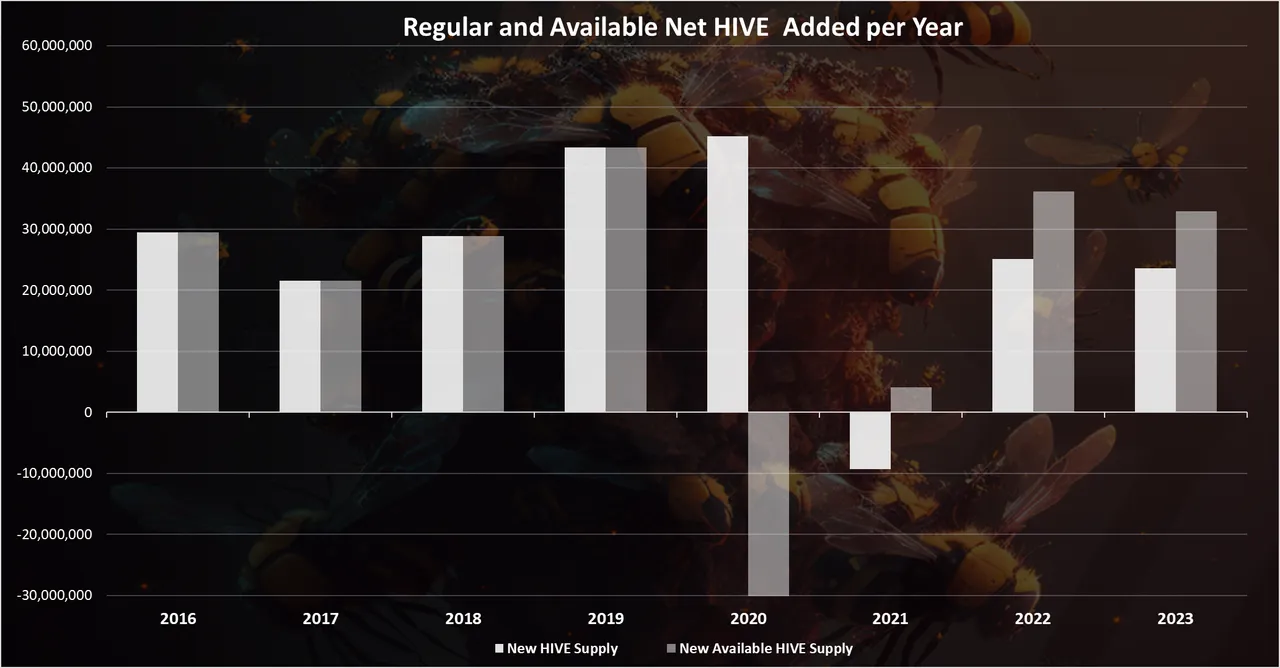
This is the amount of HIVE added each year, for the regular and the available HIVE supply.
The white columns are the regular inflation, while the grey is the available inflation.
As we can see, up to 2020, these two columns are the same, adding between 20M to 40M new HIVE each year.
Then in 2020, the Hive HardFork happened, and we have a huge discrepancy between the regular and the available HIVE added. Basically, on top of the regular supply (around 45M new HIVE added in 2020), while as available supply there was -35M HIVE removed. This is due to the removal of the HIVE from regular supply and locking it in the DHF.
In the next year we have a somewhat comparable situation, where we can see the evolution of the HIVE supply with and excluding the HIVE balance in the DHF.
In 2021, the regular HIVE inflation is negative -10M HIVE, while the available is positive 4M HIVE. What this means that the difference around 14M HIVE, is HIVE removed from the DHF.
In 2022 the regular inflation is 25M HIVE, while the available is 36M, or 9M more HIVE. In 2023 the regular inflation is 24M HIVE, while the available is 33M.
As we can see from the numbers in 2021, 2022, and 2023, the gap between these two data points has been going down. This is due to the lower amount of HIVE tokens in the DHF that are converted to HBD each year. The biggest difference was in 2021, and each next year this will go down.
When we plot the chart above in percentage points % we get this:
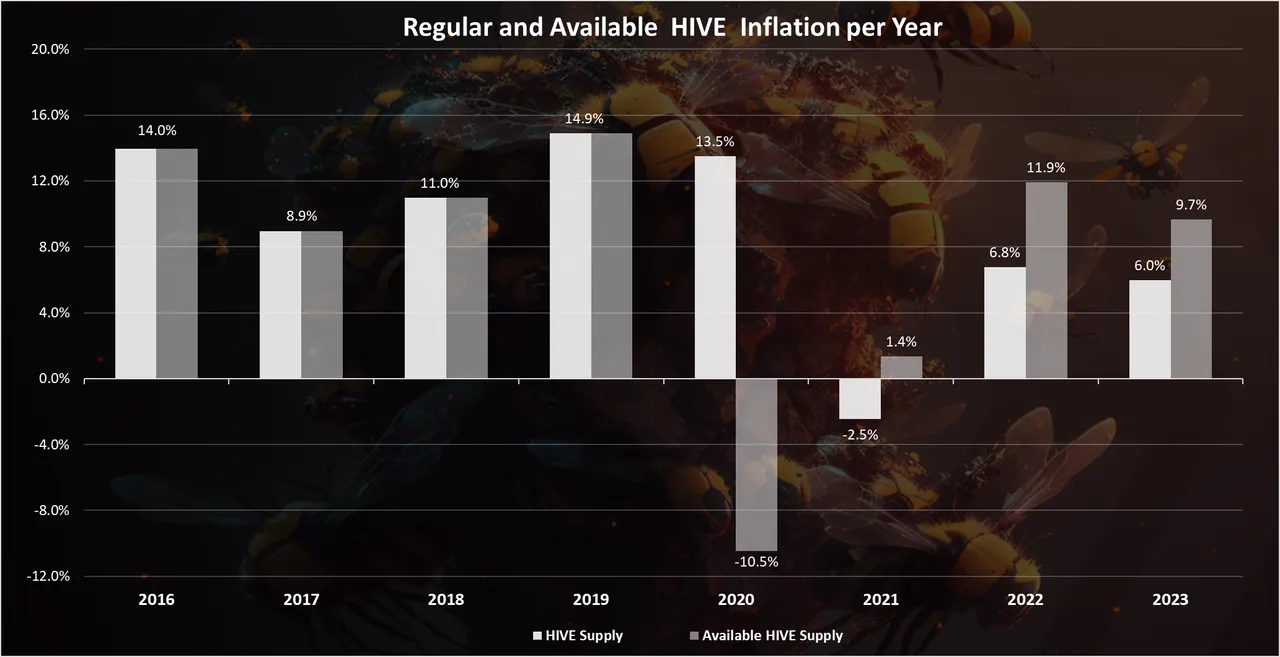
The trend here is the same as for the absolute amount of tokens added in the previous chart, just a different unit, for a better understanding.
We can see that back in 2020, we have 13.5% regular HIVE inflation vs -10.5% available HIVE inflation. In 2021, the numbers are -2.5% vs 1.4%, then in 2022 6.3% vs 11.9%, and a 6% vs 9.7% in 2023.
Obviously from the data above we can see that after the huge deep in the available HIVE inflation in 2020, the following years, this type of inflation is higher than the regular one, between 3% to 5% per year. This trend should go down going forward, as the amount of HIVE in the DHF is reduced and the two numbers will be closer to each other.
At the end to note that, when we do such analysis, as available HIVE, another important metric is the liquid HIVE, excluding the powered HIVE. This is ultimately the amount of HIVE that is available. The liquid HIVE supply is affected from the HIVE power ups, but also from the HIVE to HBD conversions.
All the best
@dalz