I don't usually bother to analyze web traffic on hive.blog, since I'm more focused on the technical development of Hive rather than Hive's success at marketing itself. Still, cloudflare send me a monthly email that shows the amount internet traffic on the site, including some geographical breakdown of that data. So I've long known that the US has consistently been the largest source of our web traffic, ever since the site first launched.
The inspiration of this post was a discussion I was having with @logic. He had found a post that was attempting to do an analysis of hive.blog's traffic based on organic search data (I think, I didn't read too closely) and it made a few incorrect conclusions about traffic on the site, so I decided to publish some of the data we have from cloudflare, after that discussion.
Hive.blog only has the data that cloudflare provides for free, so I can only access the last 30 days worth of traffic data, plus I have those monthly emails which allows me to get a little bit of historical data beyond the past 30 days. So I can only present a few graphs that may be of interest.
US web traffic for Hive.blog
This graph of US traffic was created by taking US traffic data from the emails (I deleted or moved the email from February apparently, so that's why there's a missing bar in the graph):
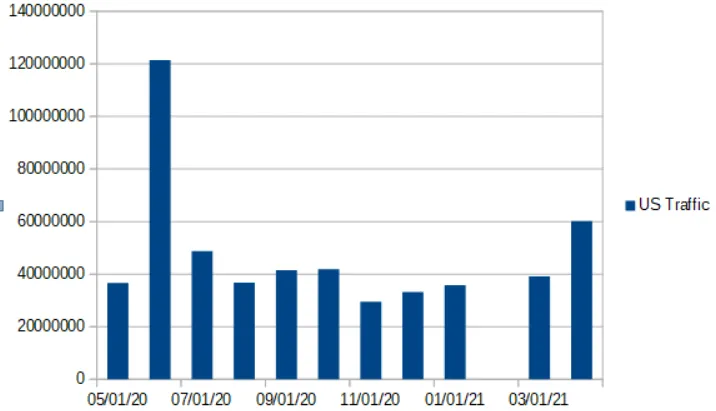
I'm not really sure why there was such a huge spike of traffic from the US during the month of May (120M), but there may not have been many other sites able to browse Hive posts during that month, so it may have born the brunt of Hive user traffic during that month. My best guess is that peakd, ecency, etc took away a lot of the traffic in the next month, once everyone could return to using their preferred post browser.
The graph shows there's been a steady growth of traffic from October of last year until now (2x growth of US traffic over that period), which is nice, especially since we know a lot of other web sites are getting more traction nowadays as post browsers and therefore competing for total Hive traffic. So overall, this looks pretty promising for overall growth of viewership for Hive social media posts.
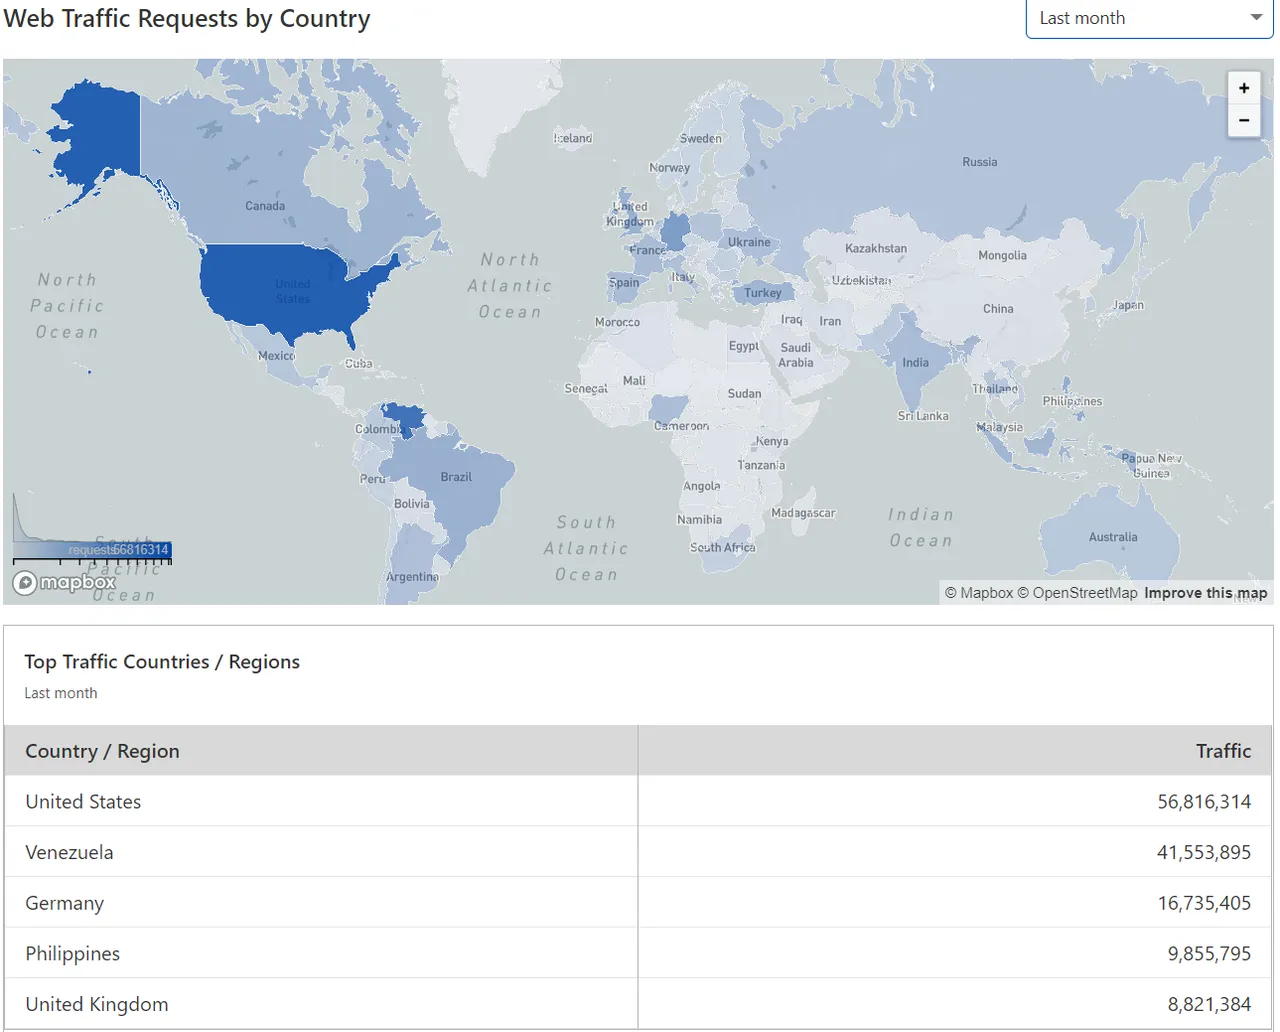
Heatmap for hive.blog's worldwide traffic
Here's a heatmap of global traffic to hive.blog, and a numeric breakdown of traffic from the top 5 countries in the last 30 days by country:
A few more from the heatmap
I also manually looked up a few other countries on the heatmap (by mousing over them) and roughly sorted the results. Now, this was a fairly tedious process and there's a lot of countries, so please don't be upset if I missed your country.
- Brazil 8.5M
- Canada 7.4M
- Turkey 7.4M
- Indonesia 6.8M
- Spain 5.8M
- India 5.5M
- France 5.2M
- Nigeria 5M
- Ukraine 4.9M
- Italy 4.6M
- Argentina 4.2M
- Bangladesh 4M
- Poland 3.8M
- Russia 3.4M
- Thailand 3.1M
- Australia 3M
- Portugal 2.9M
- Mexico 2.9M
- Netherlands 2.8M
- Pakistan 2.4M
- Columbia 2.2M
- Vietnam 2M
- S. Korea 1.8M
- Romania 1.7M
- Bulgaria 1.5M
- Serbia 1.5M
- Malaysia 1.4M
- South Africa 1.4M
- Greece 1.5M
- Japan 1.1M
- Austria 1.2M
- Switzerland 1.2M
- New Zealand 1.2M
- Belgium 1M
- Peru 1M
- Chile 1M
- Czech 0.9M
- Sweden 1M
- Norway 0.9M
- Finland 0.8M
- Ireland 0.8M
- Belarus 0.7M
- Croatia 0.7M
- Ecuador 0.7M
- Taiwan 0.5M
- Estonia 0.5M
- Macedonia 0.5M
- Slovenia 0.5M
- Denmark 0.4M
- Slovakia 0.4M
- Hungary 0.4M
- Suriname 0.4M
- Israel 0.3M
- Lithuania 0.3M
- Uruguay 0.3M
- Paraguay 0.3M
- Panama 0.3M
- Costa Rica 0.3M
- Saudi Arabia 0.2M
- Iran 0.2M
- Egypt 0.2M
- Morocco 0.2M
- Kazakhstan
- Algeria 0.2M
- Dominican Republic 0.2M
- Latvia 0.2M
- Sri Lanka 0.2M
- Guatemala 0.2M
- Bolivia 0.2M
- Nepal 0.2M
- Iceland 0.1M
- El Salvador 0.1M
- Kenya 0.1M
- Cuba 0.1M
- China 0.1M
- Bosnia/Herz: 0.1M
- Moldova 0.1M
- Azerbaijan 0.1M
- Oman 0.1M