In my last dev post I promised to review some of the data I've been looking at with regard to increasing hive-related web and api server traffic. First I'll cover traffic to hive.blog, then move on to api.hive.blog.
Increase of web page requests to https://hive.blog
Below is a graph of network traffic to https://hive.blog. The important graph to look at is the top one that starts at around 10 million bits per second and ends around 26 million bits per second. This is the amount of incoming traffic requests to fetch web pages on the site.
Note this graph doesn't show traffic from API calls to api.hive.blog requests (I'll show that in a separate graph), this graph is only showing increased traffic to the hive.blog web site.
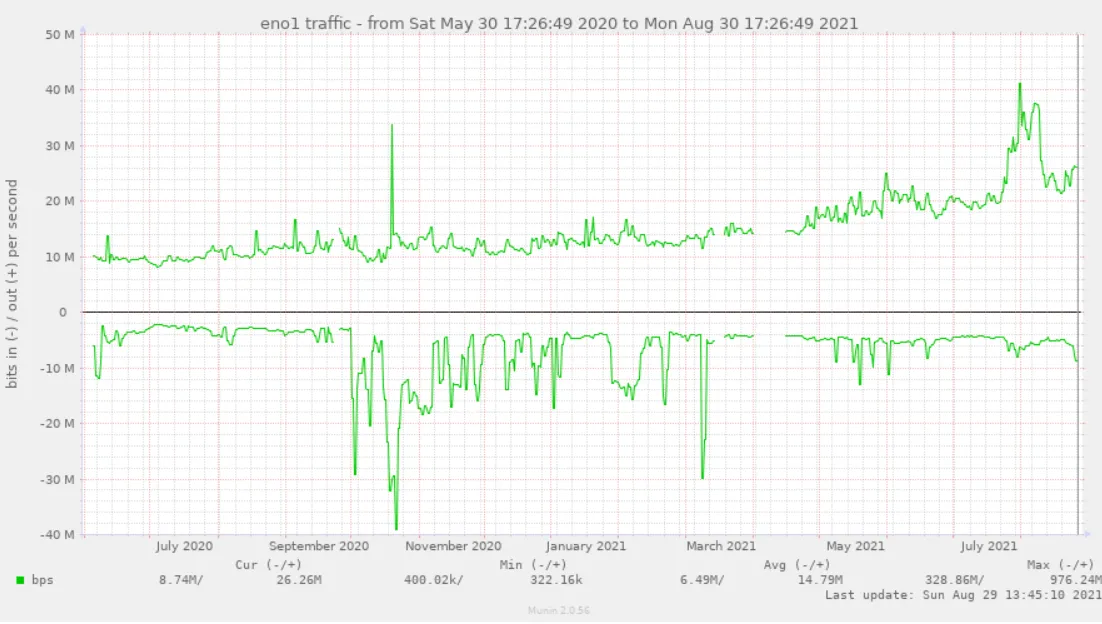
We can see that hive.blog has had a slow but steady traffic increase starting from when we first starting collecting this data (late May in 2020). By late April of 2021, we had about a 30% increase (13Mbps incoming from a starting point of 10Mbps) over an 11 month period. Next we see that growth has dramatically accelerated to where we've hit 26Mbps as of the end of August (about 2x gain over 4 months).
What's that spike to 30-40M?
You might be wondering what that spike in early August was. I was also curious about that, and I discovered that it was google's search bot indexing all our web pages (yes, it went on for a couple of weeks). I'm no expert when it comes to SEO, but I suspect that is a good sign for future organic searches from google's search engine.
After googlebot finished indexing the site, you can see the graph has returned to its previous trend line.
Cloudflare data
According to our Cloudflare control panel, in the past 30 days, hive.blog has had 2.46 million visitors, 231.56 million requests, and served up 19TB of data. During July, by comparison, it served up 16TB of data (I don't have the other numbers to compare against).
Increased traffic to api.hive.blog
Api.hive.blog is one of several Hive API servers that provides data to Hive-based apps (including hive.blog). Below are some spreadsheets showing how api traffic has increased recently.
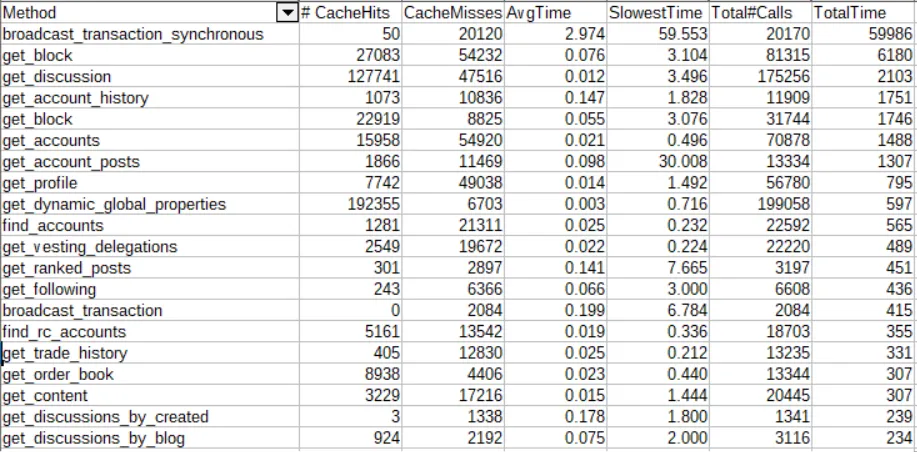
On July 28th (around the time api servers started getting strained by splinterlands sudden growth), one hour of API traffic (ranked by overall time consumed by each type of API call) looked like this:
As of yesterday, one hour of traffic around the same time looks like this:
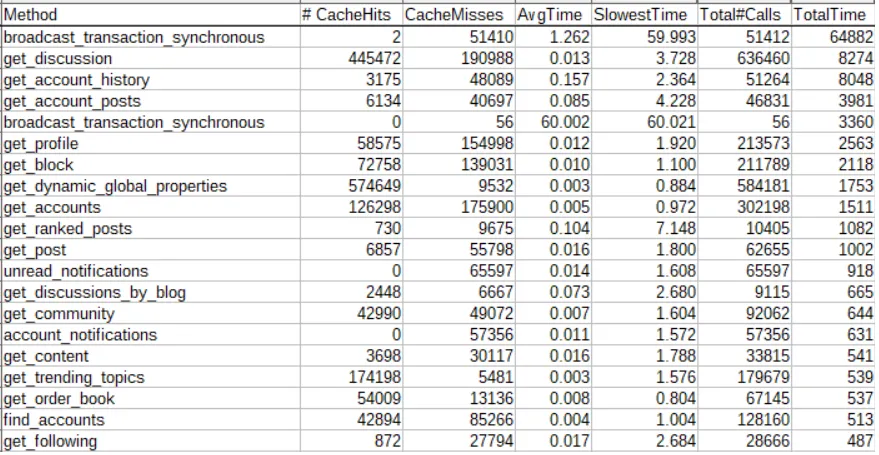
Synchronous broadcast traffic still increasing
The first thing to note is that despite most Hive apps changing to use the more efficient broadcast_transaction api call, we still are seeing an increasing number of "bad" broadcast_transaction_synchronous calls (increased from 20K/hr to 51K/hr in the past 30 days) . Presumably this is largely from bots playing Splinterlands.
Fortunately, this increase isn't posing much of a problem now, as those calls are all being directed to a separate hived server now, preventing those slower calls from choking out all the other API calls. And we can see that this separation is also beneficial for the synchronous calls as well, so much so that even though traffic has more than doubled, the average time to process a synchronous call has decreased from 2.97s to 1.26s.
But this is worthy of note for other API server nodes: if you haven't yet setup a dedicated hived node to handle your synchronous traffic, your node could be in for trouble in the near future. Note that the easiest way to do this is just run an extra lightweight consensus node (no need for an account history node to process transactions).
Social media-specific traffic also increasing dramatically
When you visit a post on hive.blog, it makes a call to get_discussion to get the post contents and comments. In the past 30 days, calls to get_discussion have increased from 175K/hr to 636K/hr (~3.6x increase). Another common social media API call is get_ranked_posts which is used for things like showing the list of trending posts. We can see that calls to this increased from 3917/hr to 10405/hr (~2.6x increase).
Many API calls are faster, despite the increased traffic
Despite the increased traffic to the node, we can also see that many of the API calls are faster than they were. For example, get_following has an average time of 0.017s vs a previous time of 0.066s (~3.9x faster). This is just another benefit of separating out the synchronous calls that were previously choking performance of the other API calls.
Plenty of room to grow
The most interesting thing we can see from looking at this data is that despite API traffic having nearly tripled over the past 30 days, the effective loading on the API server is pretty minimal, and in fact with the reconfiguration of the node to separate out the "bad" synchronous calls, the node is actually performing faster than it did before the traffic increase.