Welcome to the daily financial report about the Hive blockchain.
All the information presented in this report is based on the data collected from the blockchain until 2021-09-01 midnight UTC. This report aims to provide you with a clear view of what is happening on the Hive blockchain.
1. Price
 | 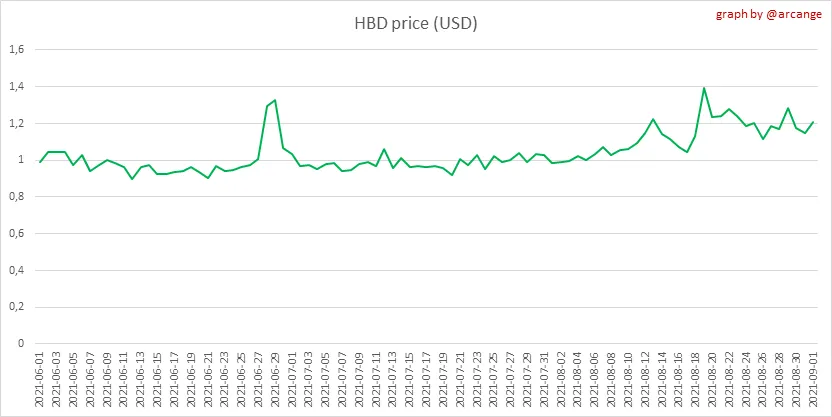 |
These graphs show the evolution of prices in USD for HIVE and HBD.
2. Supply
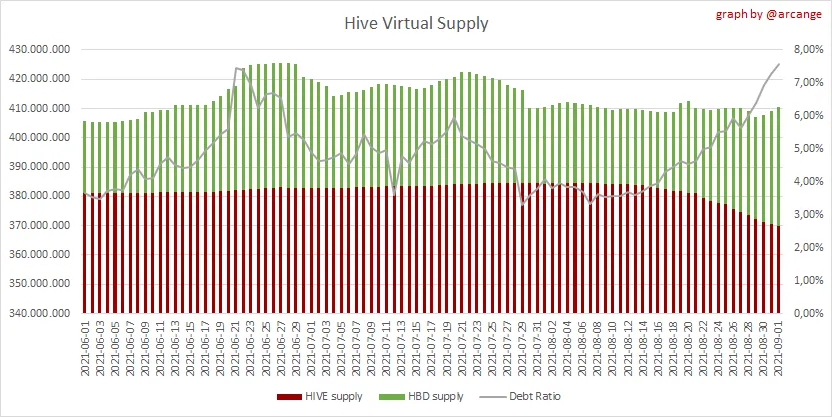
This graph shows the evolution of HIVE Virtual Supply. The virtual supply is the sum of HIVE supply (liquid Or staked HIVE) and HBD supply (converted into HIVE).
The graph also displays the debt ratio (HBD supply / HIVE supply). Keep in mind that since hardfork 24 funds in the treasury (@hive.fund HBD balance) don't count towards the HBD debt ratio
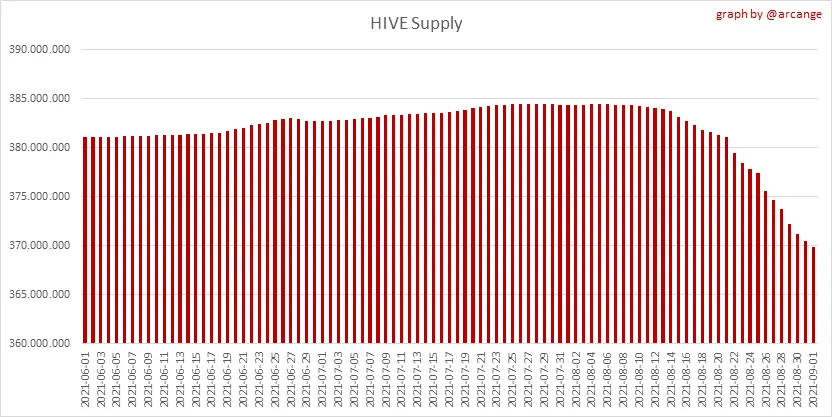 | 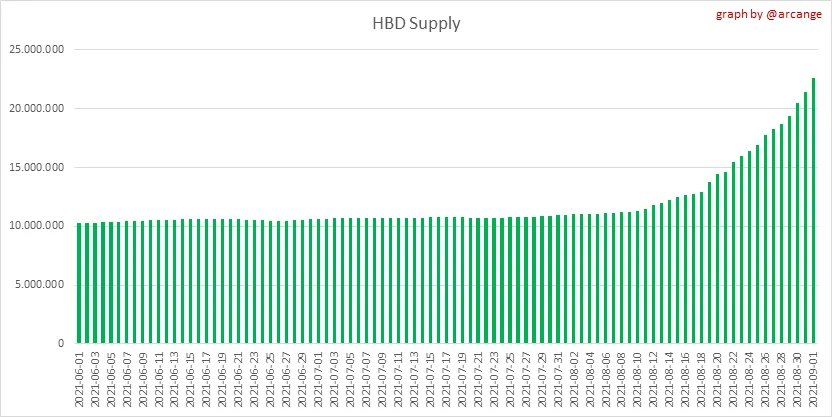 |
These graphs show the evolution of the HIVE Supply (both liquid and staked) and the HBD supply.
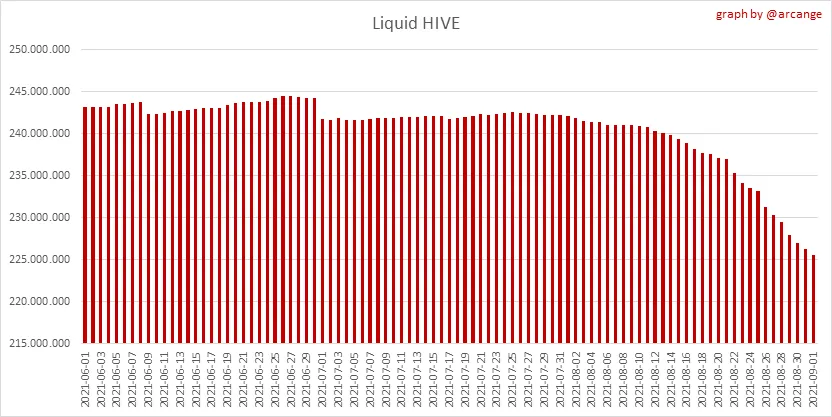 | 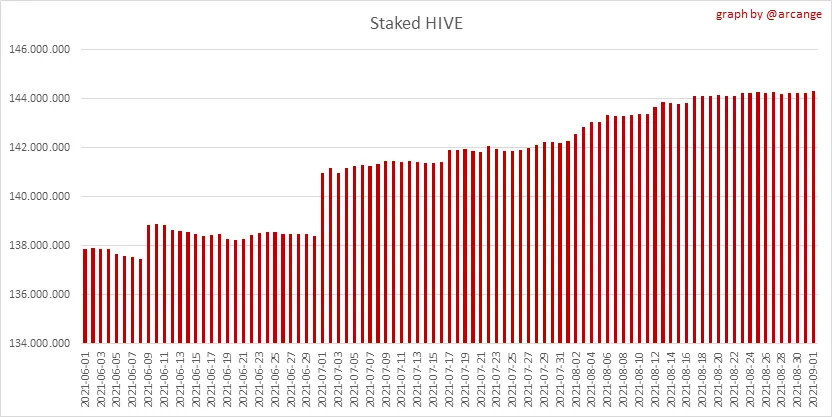 |
These charts show the evolution of the liquid HIVE and the staked HIVE (Hive Power).

This graph shows the overall Hive tokens distribution
3. HBD Savings
Note: As of 2021-06-30 (HF25) interest Is only paid for HBD which are stored in savings.
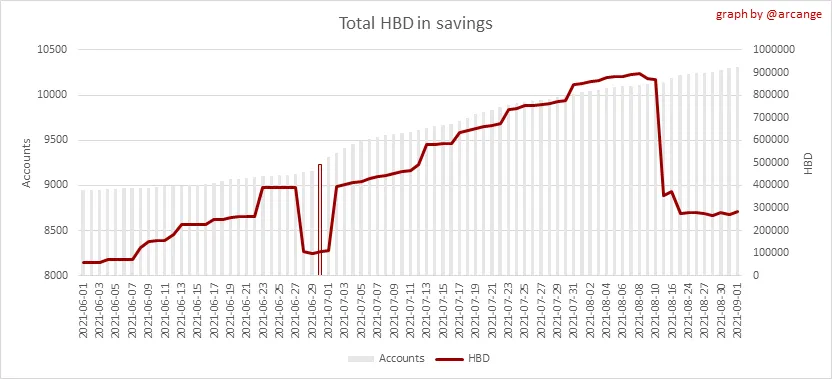
This graph shows how much and how many accounts store HBD in savings.

This chart shows the amount of interest paid each day for holding HBD and how many accounts received such interest.
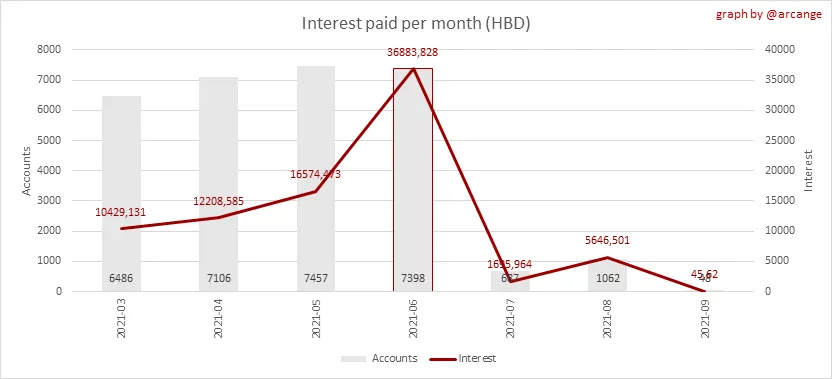
This chart is the same as the previous one, but data are grouped by month.
4. Balances
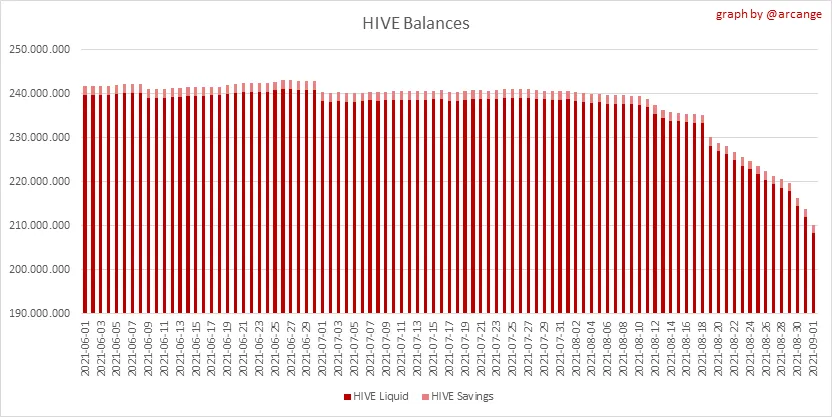
This graph shows the number of HIVE, both liquid and In savings, held by all accounts.

This graph shows the number of HBD, both liquid and In savings, held by all accounts
5. Conversions
Note: As a reminder, conversion requests are only finalized after 3 days. It is only then that it is known exactly how many HIVE were burned in return for the HBD received at the time of the conversion request.

This graph shows the number of HIVE collateralized due to requests to convert HIVE to HBD over the past few days.
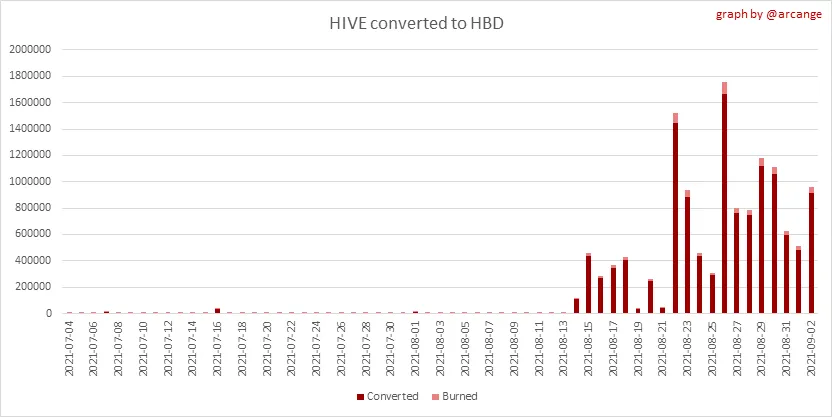 |  |
These graphs show the number of HIVE effectively used by the conversion process (HIVE converted and 5% HIVE fee which is burned) each day and month when requests to convert HIVE to HBD have been finalized.
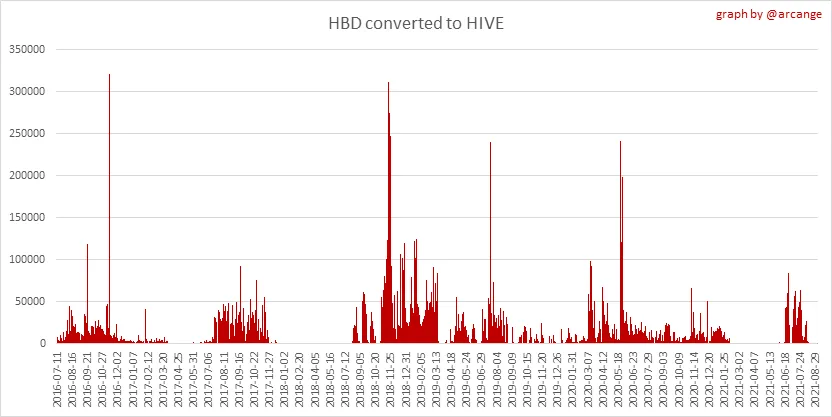 | 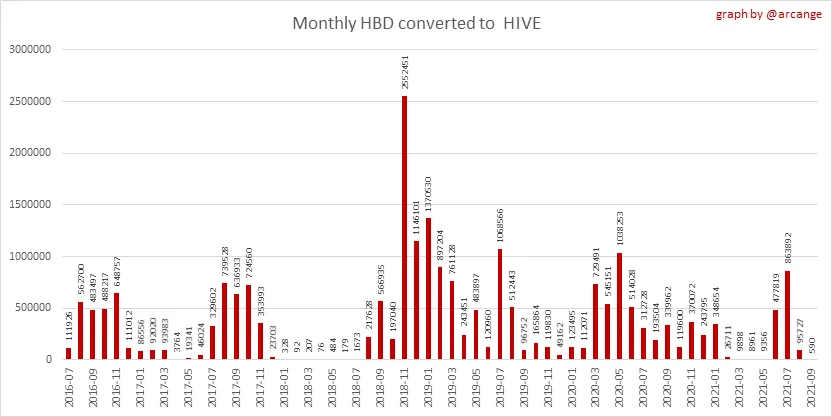 |
These graphs show the number of HBD burned, each day and each month, following requests to convert HBD to HIVE.
6. Power Up and Down

| Date | Account | Amount |
|---|---|---|
| 2021-09-01 06:34:36 | @pouchon | 105,131.725 HIVE |
| 2021-09-01 05:49:15 | @pharesim | 32,222.563 HIVE |
| 2021-09-01 11:30:57 | @grot | 8,541.395 HIVE |
| 2021-09-01 03:01:51 | @trumpman | 7,787.135 HIVE |
| 2021-09-01 11:07:36 | @jgcastrillo19 | 3,250.743 HIVE |
| 2021-09-01 03:36:06 | @womic | 2,812.211 HIVE |
| 2021-09-01 12:20:48 | @canelarecetas | 2,000.173 HIVE |
| 2021-09-01 08:42:33 | @laradio | 1,924.909 HIVE |
| 2021-09-01 04:13:54 | @missaj | 1,347.712 HIVE |
| 2021-09-01 10:15:27 | @darkflame | 1,331.711 HIVE |
This graph and table show the amount of power down initiated over the last 7 days, and who initiated the largest yesterday.
| Account | Power Up | Account | Powerdown |
|---|---|---|---|
| @grot | 8,523.245 HIVE | @ocdb | 15,209.371 HIVE |
| @vanje | 6,238.000 HIVE | @aggroed | 3,619.919 HIVE |
| @singhcapital | 5,666.405 HIVE | @felixxx | 3,124.047 HIVE |
| @borivan | 4,530.905 HIVE | @nathanmars | 3,119.783 HIVE |
| @thekittygirl | 1,500.000 HIVE | @jeenger | 2,730.799 HIVE |
| @thefew.studio | 1,373.540 HIVE | @followbtcnews | 2,702.341 HIVE |
| @holoferncro | 1,158.265 HIVE | @jphamer1 | 2,307.522 HIVE |
| @jphamer1 | 1,125.000 HIVE | @pharesim | 2,184.399 HIVE |
| @cmplxty | 1,100.000 HIVE | @ocd-witness | 2,052.275 HIVE |
| @kryptodenno | 1,091.000 HIVE | @reward.app | 1,800.092 HIVE |
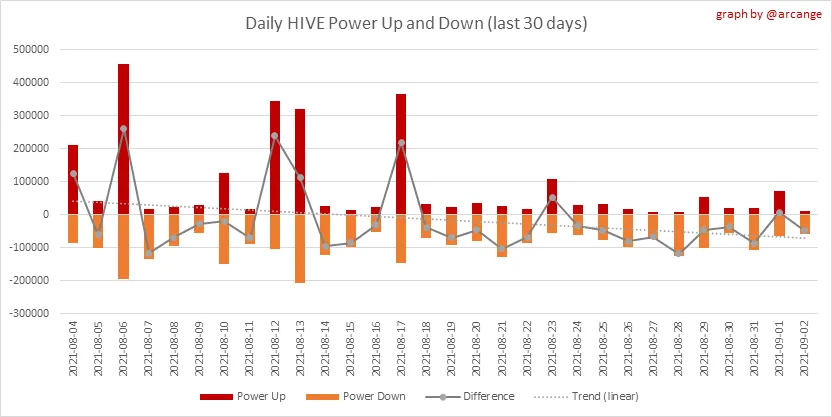
This graph shows the daily HIVE power-up, power-down, and the resulting variation over the last 30 days. The table shows the topmost power-ups and power-downs of the day.
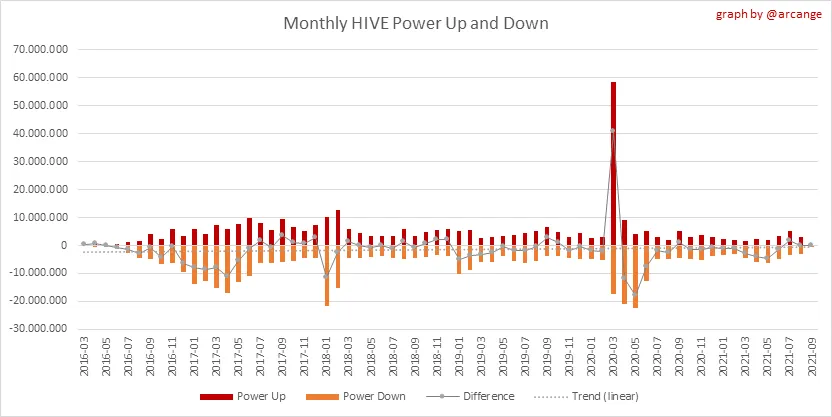
This graph shows the monthly HIVE power-up, power-down and the resulting variation.
Values for the last 3 months
| Period | Power Up | Powerdown | Difference |
|---|---|---|---|
| 2021-09 | 66,010.000 | 73,090.000 | 7,080.000 |
| 2021-08 | 3,144,598.000 | 3,212,814.000 | 68,216.000 |
| 2021-07 | 3,415,366.000 | 5,186,384.000 | 1,771,018.000 |
7. Transfers
 |  |
These graphs show the volume (in USD) of HIVE and HBD transferred between accounts.
8. Exchanges
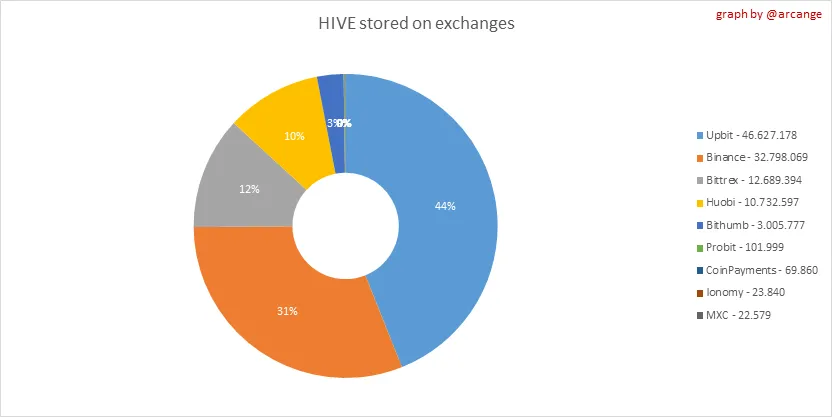 | 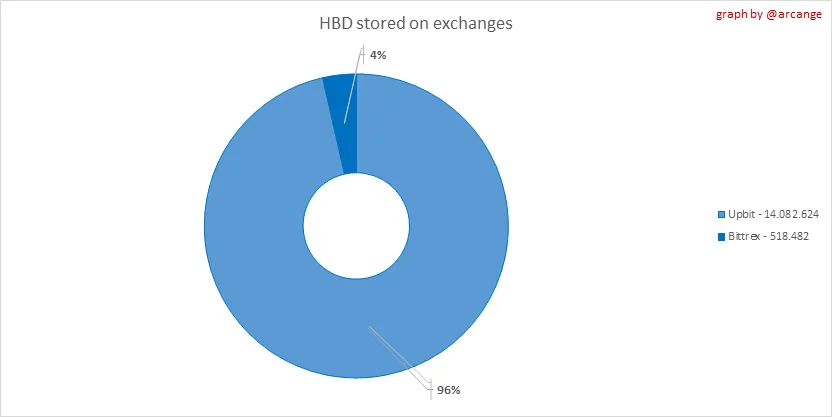 |
These graphs show the amount and distribution of HIVE and HBD stored on the exchanges where they are listed.
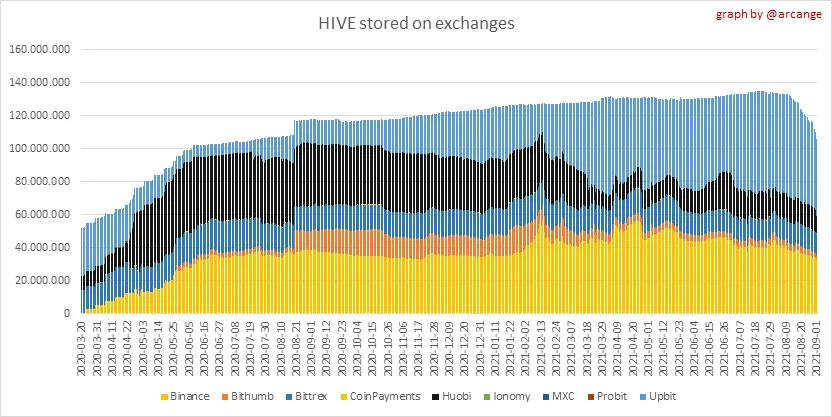 | 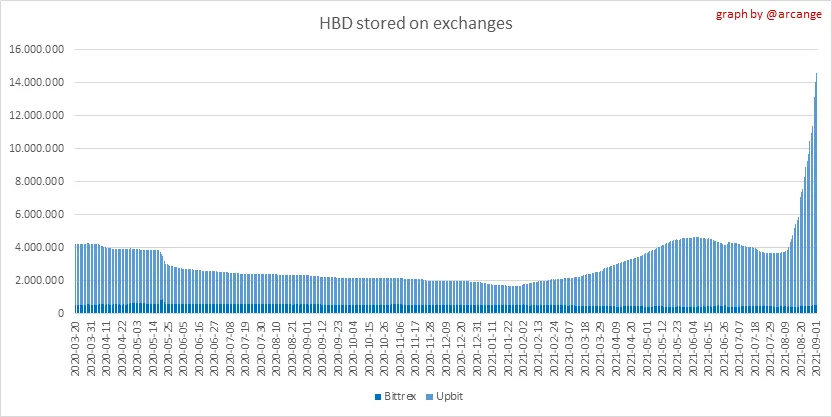 |
These graphs show the daily evolution of HIVE and HBD stored on the exchanges where they are listed.
I hope you find those stats useful. If you would like to see different stats, feel free to drop me a comment. Your feedback is more than welcome.
Thanks for reading.
Check out my apps and services