Dear Splinterlands Community,
In this post, I would like to introduce the features in SplinterTrends which require login.
Currently, there are 3 "private" features:
- Price changes of your cards
- Card overview report
- Average price report
Logging in
If you want to use the private features of SplinterTrends, your Hive address must be whitelisted. To get this done, follow these two steps:
- Join SplinterTrends Discord server (https://discord.com/invite/CRSRKpQXH)
- Post your Hive address to the #whitelist-me channel or contact me directly (Peter - SplinterTrends)
After whitelisting, you can log in with Hive Keychain by clicking the Login button in the upper-right corner:
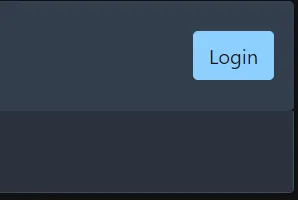
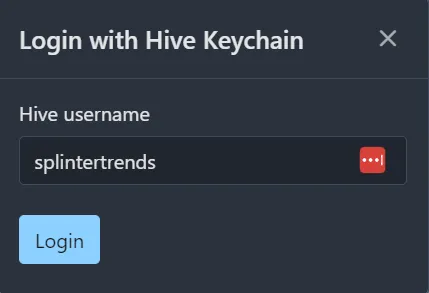
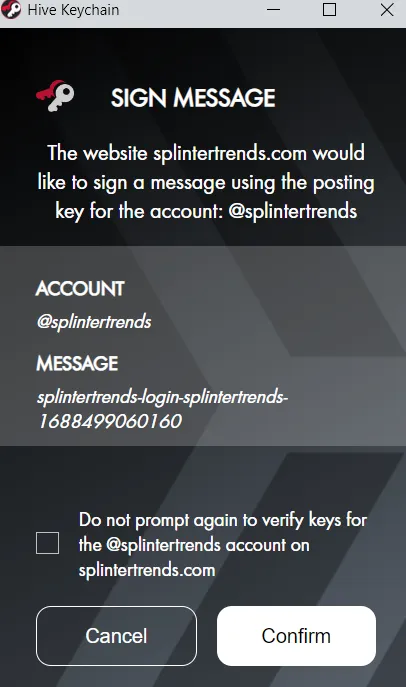
(Keychain will sign only a generated login message with your Posting key)
When you next open the application, it will remember you (for a while) 😉
Feature 1: Price changes of your cards
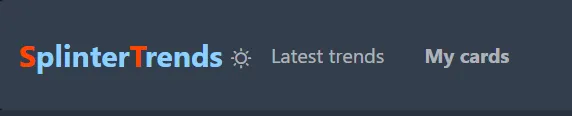
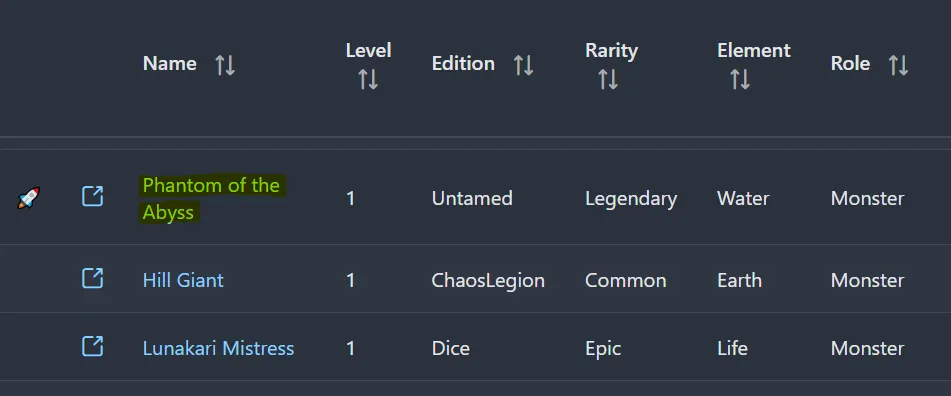
After login, a new menu item named My cards will appear:
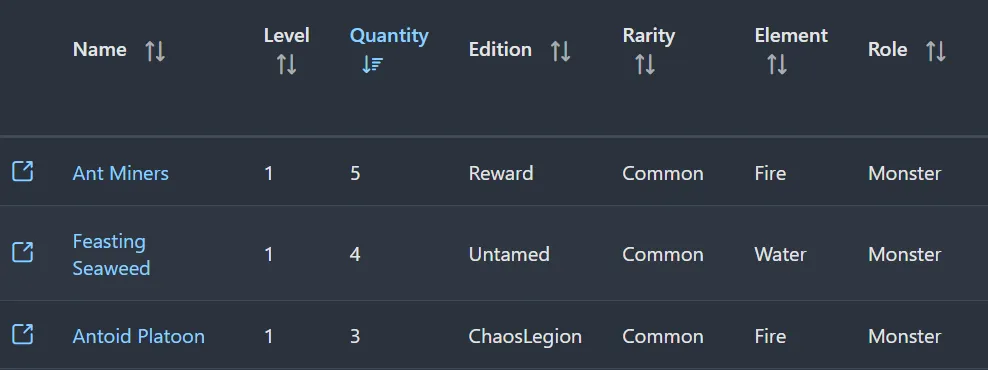
This is a similar page to the dashboard. The main difference is, that the table will contain your cards only. Other notable differences are the followings:
- There is an "All" option in the level selector. This is selected by default and the table contains all of your cards regardless of their level.
- If you have multiple cards from one type, they will be merged in a single row. The "Quantity" column will show the number of cards:
Basic settings, filtering, and the meaning of columns are the same as in the opening dashboard.
Feature 2: Card overview report
If you click on any card name, the Card overview report will pop out:
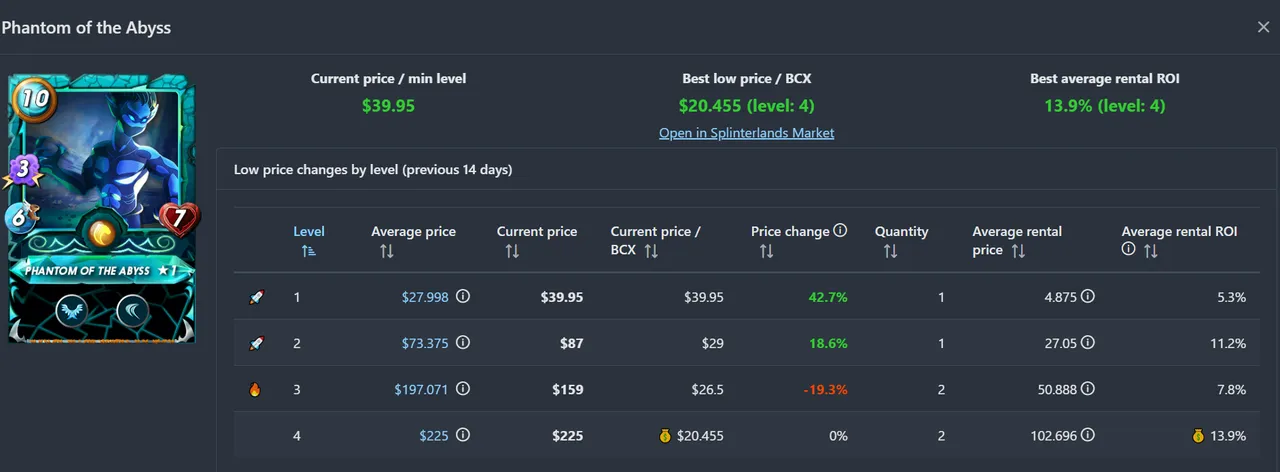
In this report, you can check the following information for each level:
- Average price in the previous period
- Current price
- Current price/BCX
- Price change (difference between current and average price)
- Average rental price in the previous period
- Average rental ROI (This is only a rough calculation of the possible rental return of investment ((Average rental price * DEC price * 365) / average price))
You will find 💰 icons for the best price/BCX and average rental ROI values
Feature 3: Average price report
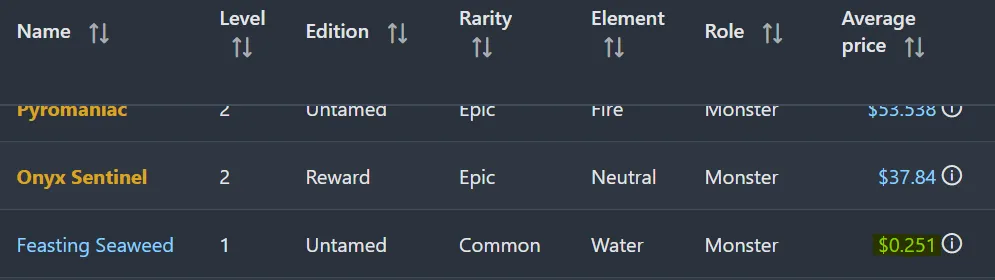
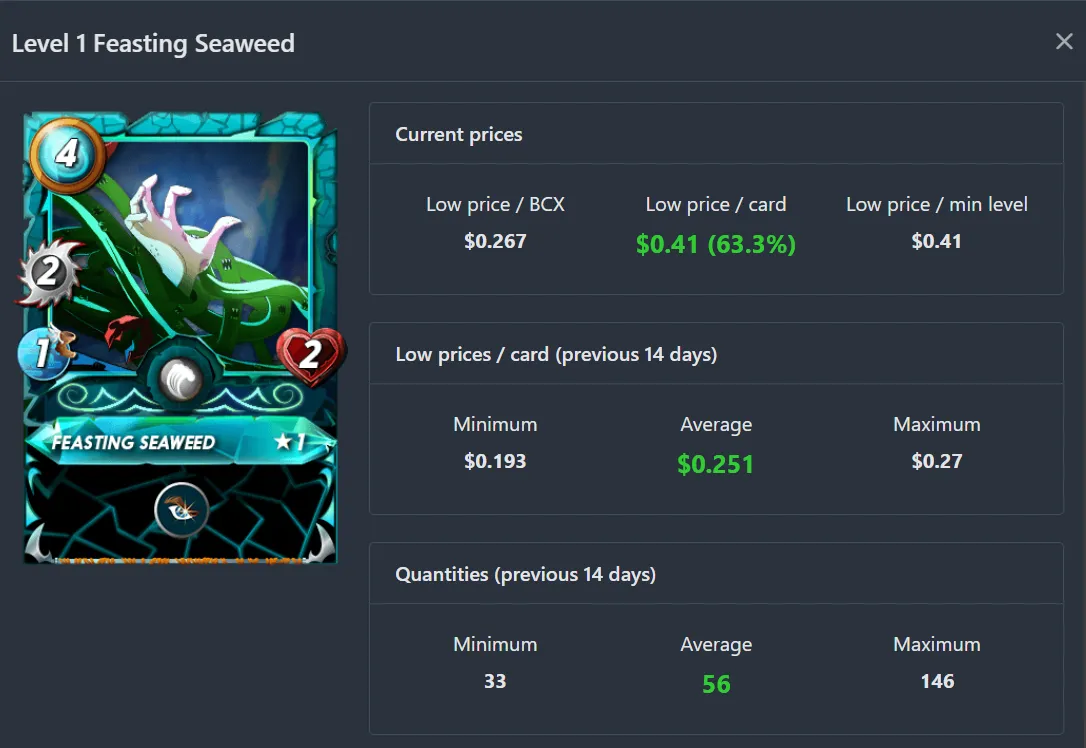
If you click any value in the "Average price" column, the Average price report will pop out:
The report has 3 parts:
- Current prices, min/max/average low price, min/max/average quantities in the previous period:
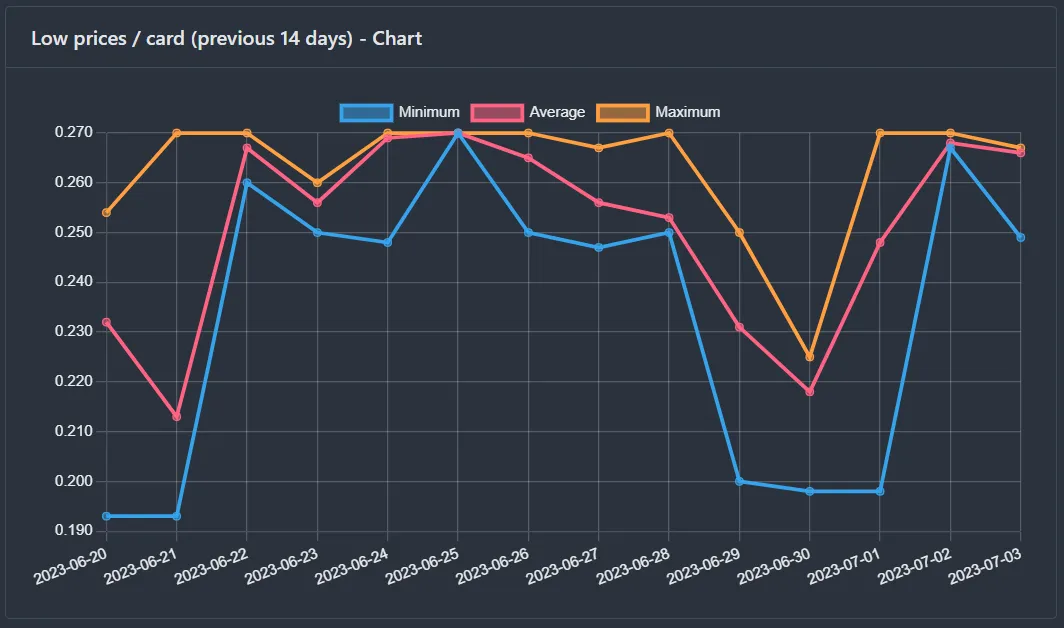
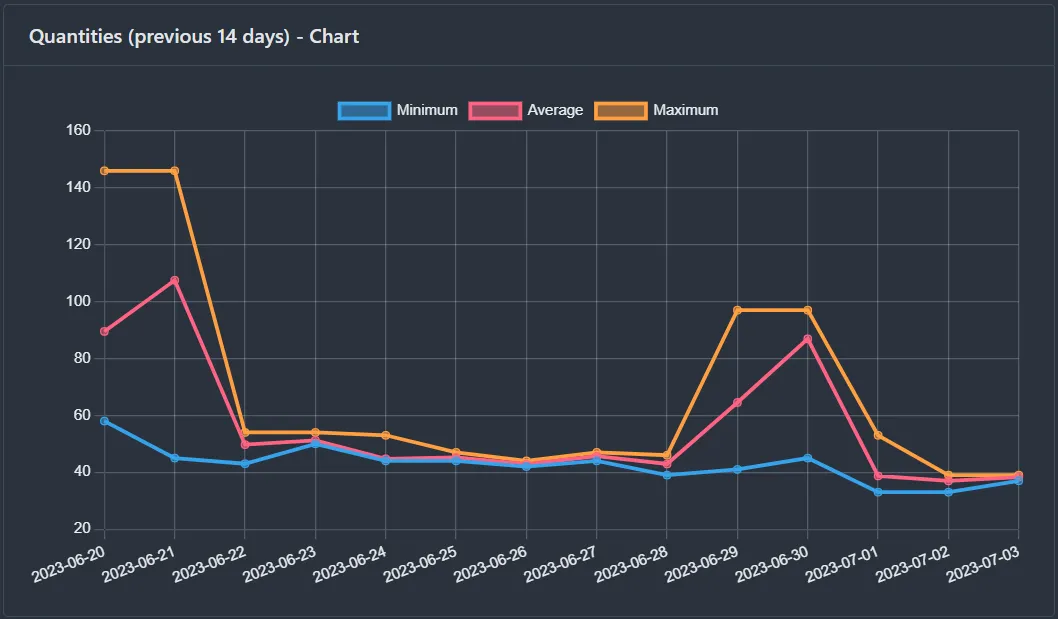
- Two charts, which describe the price and quantity changes in the previous period:
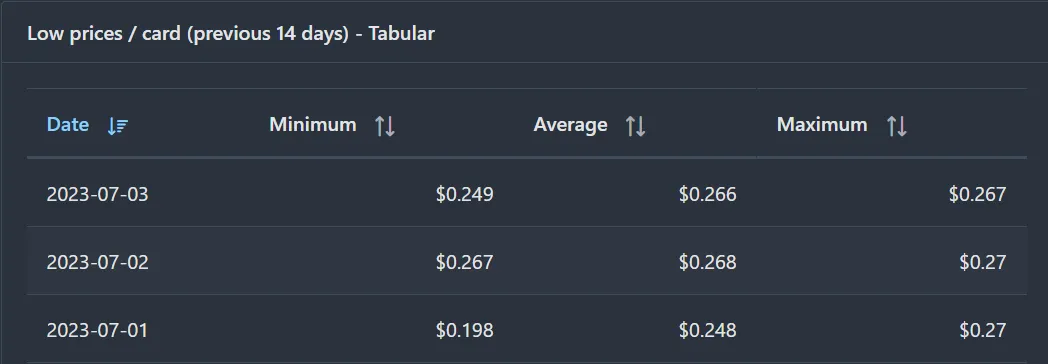
- And two tables, if you want to examine the prices/quantities in a tabular format:
Report Credits
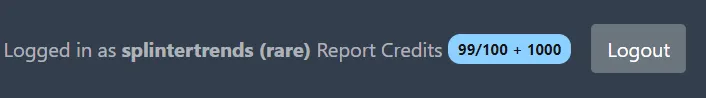
Because running reports have a little bit of performance impact, I introduced the Report Credit system. Each user has a certain amount of Report Credits. Every time, you run a report, one RC is consumed. The maximum number is 100 and you get 5 additional RC in every hour. This system prevents bombing the application with tons of report queries.
You can check your balance in the upper-right corner:
That's all! I hope, that these functions will help you to make even better buy/sell decisions than before 😀
You can check also my introductory posts:
Welcome to SplinterTrends
Basic functionality in SplinterTrends
Happy browsing!
Peter
https://splintertrends.com
https://twitter.com/SplinterTrends
https://discord.gg/YU82wKDhhC
https://splinterlands.com?ref=splintertrends