Exactly one week ago I posted about the use of the "Open Interest" as an excellent indicator for trading, in particular for those that like to "play" with the Futures game.
I actually use this tool in a daily basis in order to build a trading decision with great success combined with Elliot Waves theory, S/R, MA, Patterns recognition and RSI.
It is funny how I envisaged the inminent fall of YFI due to an "Open Interest" divergence and, also days before, the rise of CARDANO due to an iHS pattern and an increasing "Open Interest"too...but, I have to admit that I was so focused on scalping/trading each and every crypto I saw with good Setup conditions in the low time-frames that I lost totally the bigger picture of BITCOIN versus its OPEN INTEREST on the daily Chart.
The EW count on BTC was telling that the 5th wave was on-going, yes, but who knew at that moment how high it would have climbed?
Extended 3rd and 5th waves are really very frequent on Crypto, specially in a Bull Market so, we try to forecast the end of those waves by using FIBONACCI projections, pattern projected targets or detecting known levels of resistance, but, what happens when the asset or crypto you trade is near or, even worse, beyond the previous ATH?
As I said, maybe the use of FIBO levels may help a litle but the most efficient is to find signals of market exhaution.
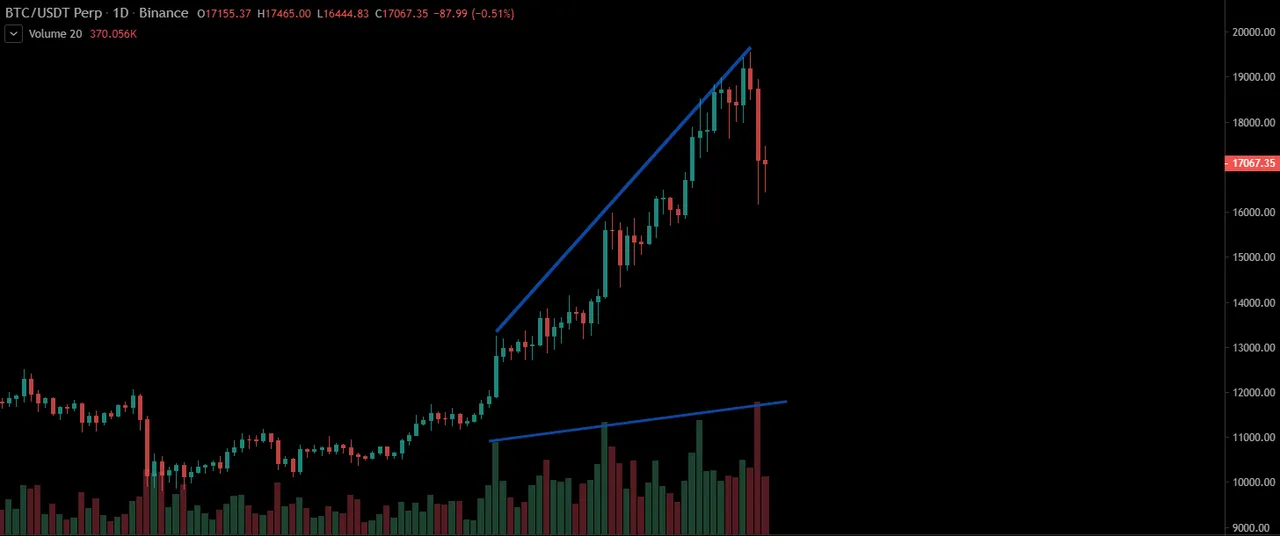
Volume is a good indication for sure, if you have a decrease on the trading volume it may indicate a lose of interest. However, the daily chart of BTC did not indicate us anything about the fall coming in terms of volume. No divergence, we passed from BULLS to BEARS
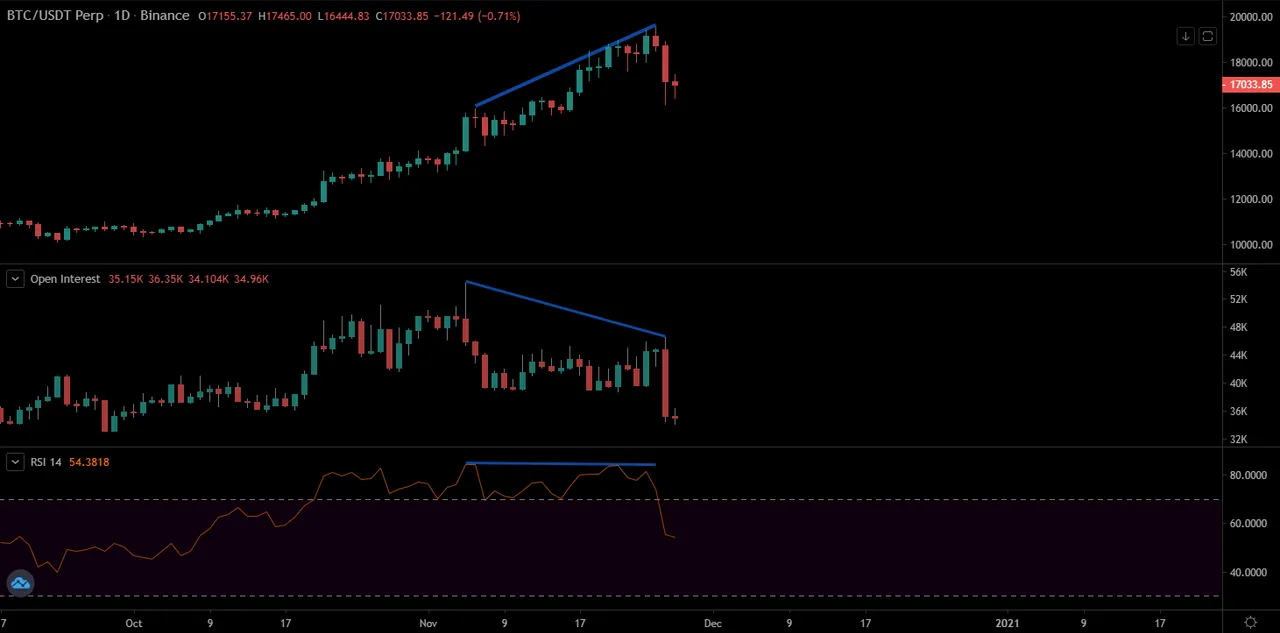
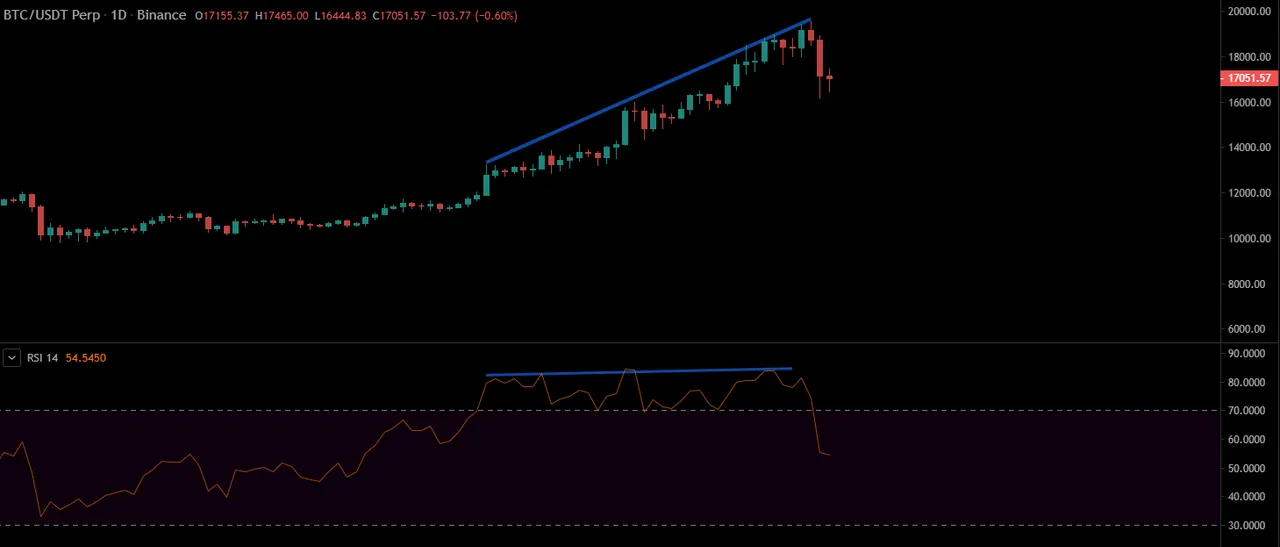
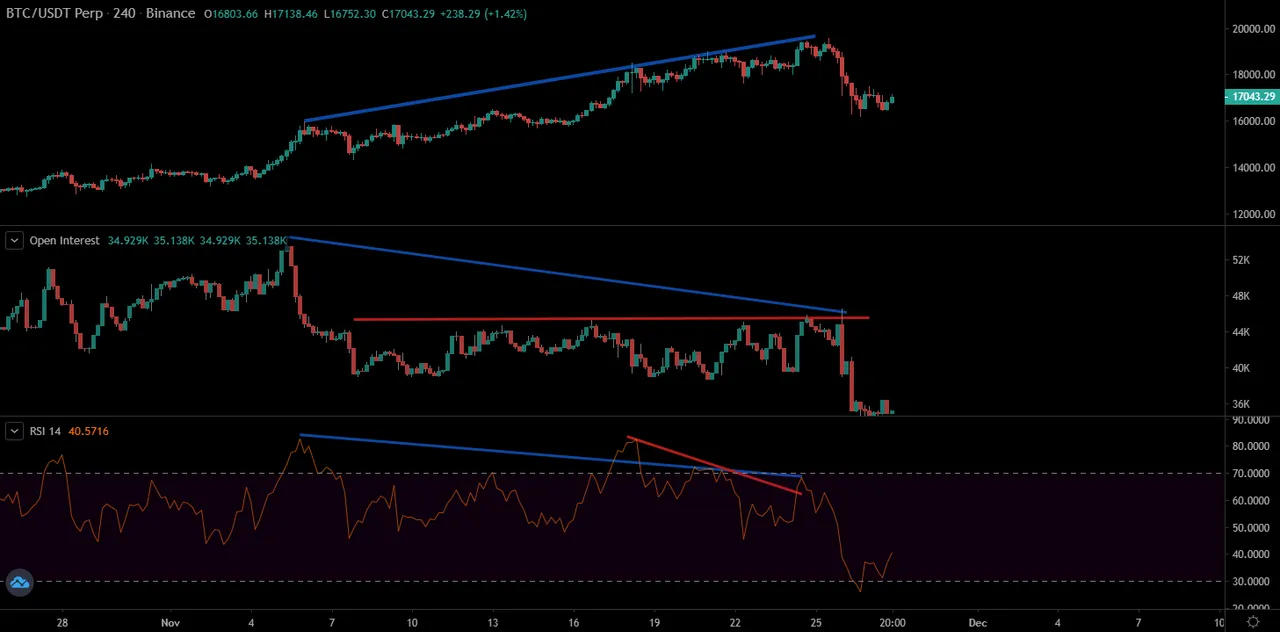
RSI is my preferred one in order to detect "DIVERGENCES", however on the daily this time the wasn't any one clear but an obvious "Overbought" condition for weeks, almos constant in the daily:
Then, we have the "Open Interest" with a clear Bearish Divergence:
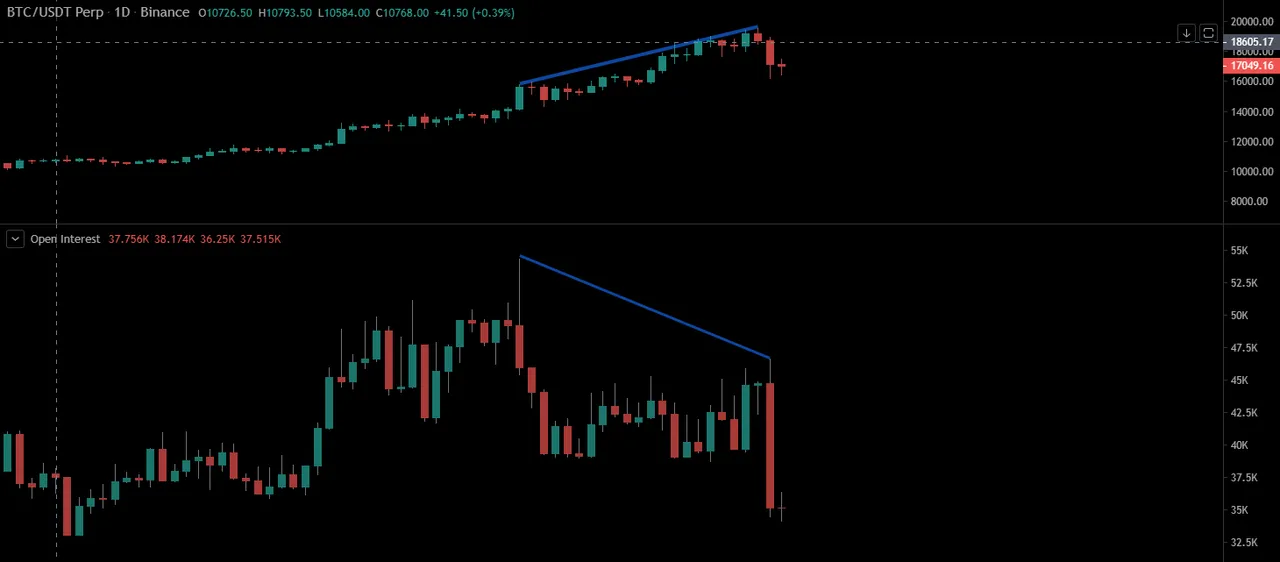
BITCOIN was in a clear decline of its open interest since it hitted 16000 USD but it reached 3000 USD more before falling abruptly.
To be more accurate sometimes is good to reduce the time-frame. On the 4h-chart the "DUMP" was more than announced:
- OPEN INTEREST FLAT (IN RED) despite the sustained price uptrend, no creation of new contracts.
- RSI (in RED) increasing the divergence in front of the price = BEARISH
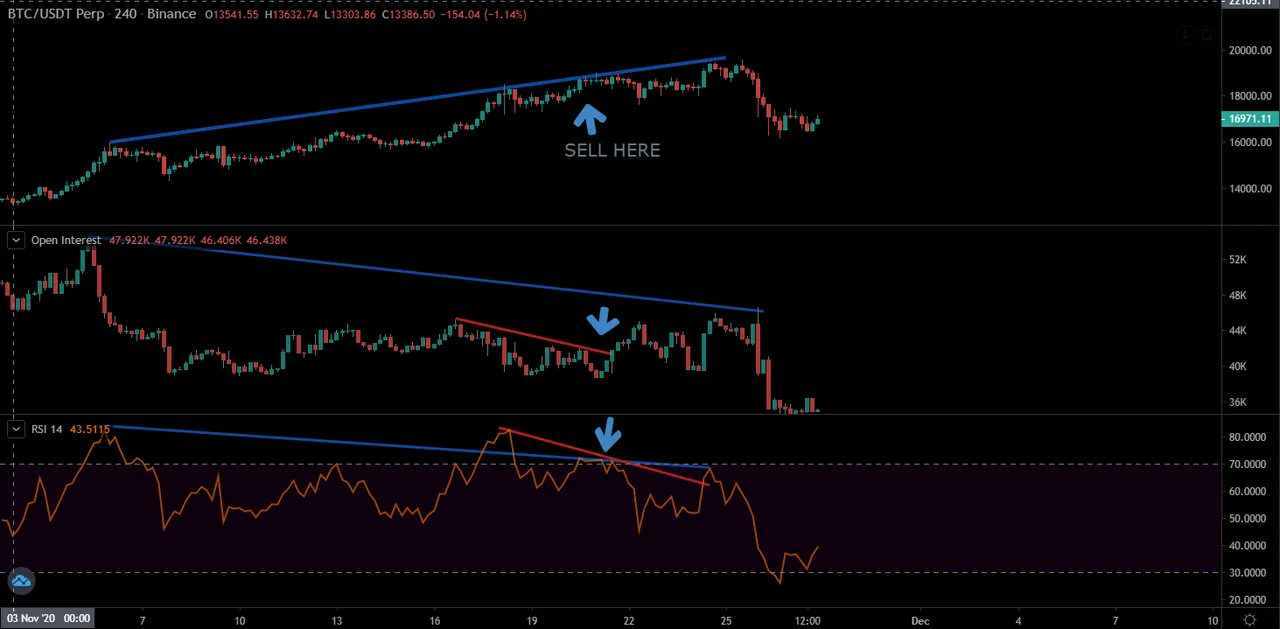
Yep, it looks like both indicators were really warning about the arrival of the fall just a couple of days before...
Mental-Personal Lesson learnt for the future:
Close the long positions on any crypto where both indicators diverge from price on the BITCOIN chart, don't scalp/day-trade for a while and resume when the market defines the new trend...
*Disclaimer: This is just my personal point of view, please, do your own assessment and act consequently. Neither this post nor myself is responsible of any of your profit/losses obtained as a result of this information.