}
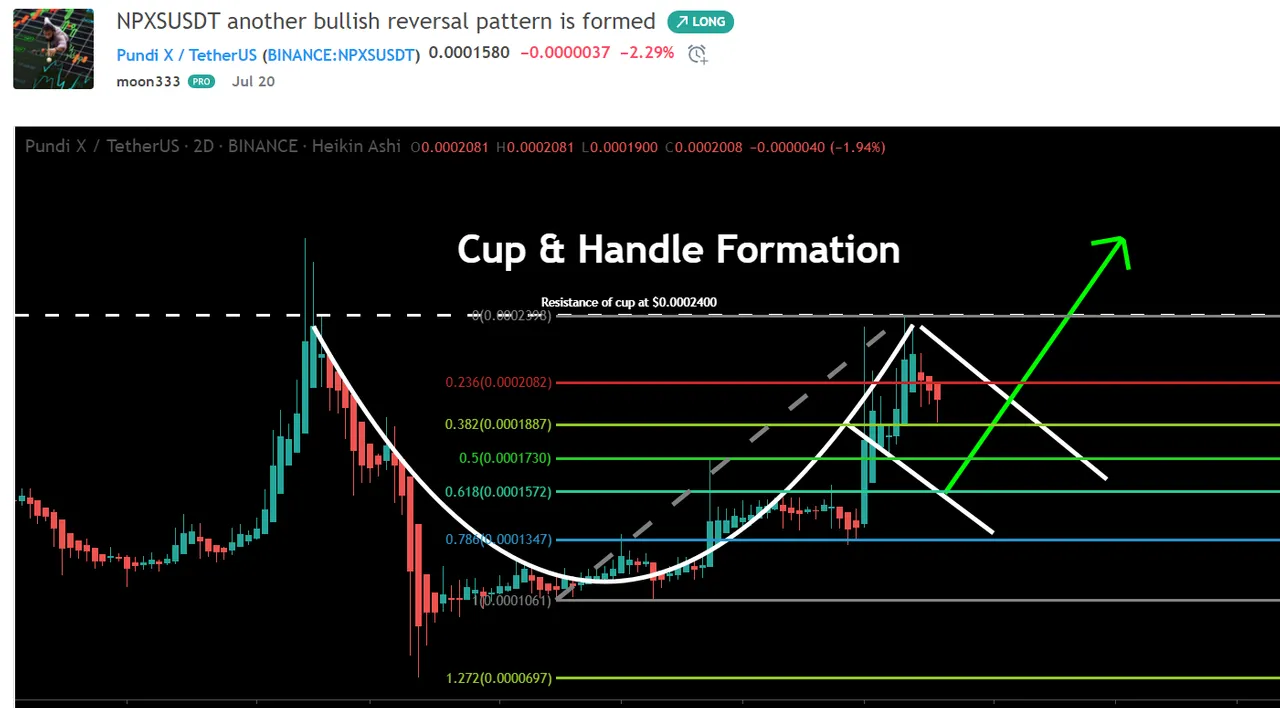
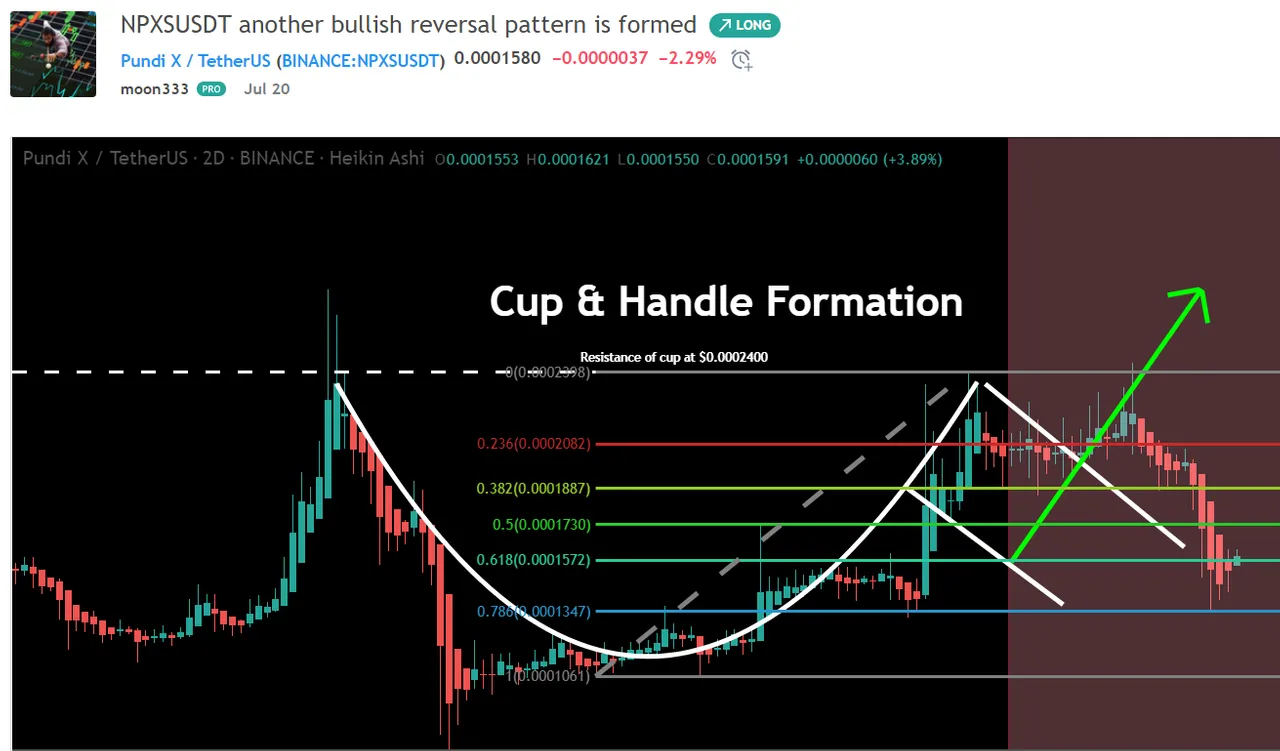
Hey, friends hope you are well and welcome to the new update on Pundi X. Previously we have seen that this token had formed a Cup and Handle formation and the price action was just completing the handle of this cup. Therefore I was expecting that the price action will try to breakout the resistance of the Cup that was at $0.0002400. Finally, the price action started the bullish move and hit the resistance of the cup but unfortunately, the priceline of NPXS token failed to breakout and dropped down again.
Previous Cup & Handle idea before execution:
Click here to visit this old article on trading videw
Previous Cup & Handle idea after execution:
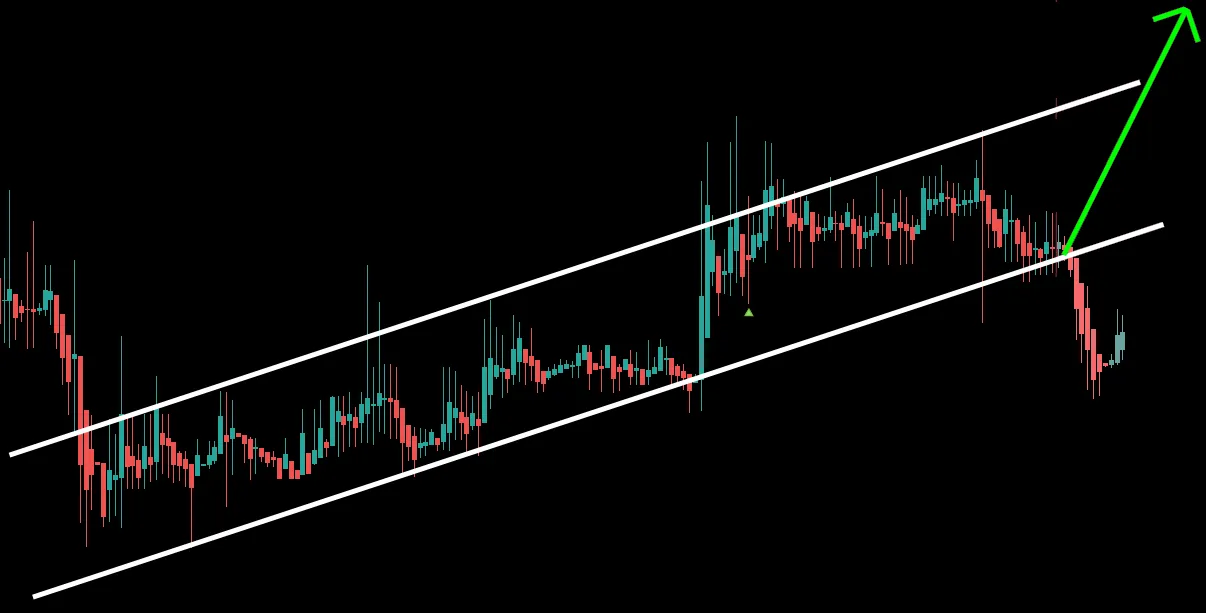
During this drop the price action also broke down the support of the up-channel where it was moving since mid of March 2020.
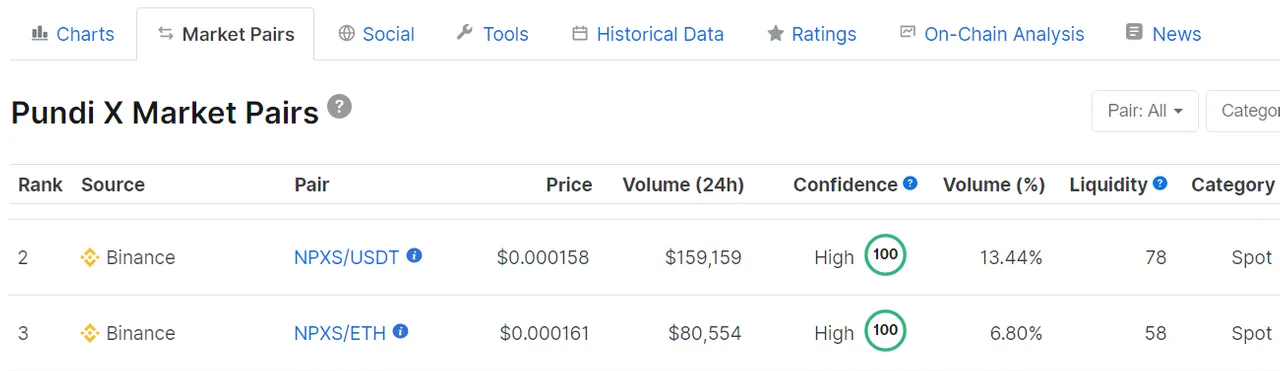
What can be the best exchange or place to buy or trade Pundi X token:
Well at this time Binance is ranked at No: 2 for NPXS trading with 100% confidence of traders and highest liquidity rate and the largest trading volume as well, therefore I would suggest you to buy or trade Pundi X token on Binance. If you don't have an account on Binance then click on the link or copy and paste it in your browser to create an account:
https://www.binance.com/en?ref=11256882
The priceline is breaking out 200 SMA:
The price action of Pundi X token also broke down the 50, 100, and 200 simple moving averages on the daily chart. Then the priceline started consolidating just underneath 200 simple moving average. Now the price action of the NPXS token is likely to breakout the 200 SMA again. Once the priceline will have strong support of 200 simple moving average then we can expect that it will also break out the 50 and 100 simple moving averages as well.

Harmonic Shark a bullish reversal formation:
Now if we switch back to the 2-day chart again then it can be easily observed that the cup and handle pattern is still not invalidated because the price action has retraced up to 0.618 Fibonacci level. This is the Fibonacci level from the bottom of the cup to the resistance. Now if we take a closer look at the chart then it can be easily seen that the price action has also completed the bullish Shark pattern on this 2-day chart and just entered the potential reversal zone. After the initial X to A leg the price action is retraced between 0.382 to 0.618 Fibonacci retracement level. Then B to C leg is projected between 1.13 up to 1.618 Fibonacci projection. There is a minor difference to reach up to 1.13 Fibonacci projection but all other legs are driven perfectly as required for the bullish Shark pattern, Therefore I have ignored this minor difference. The final leg has retraced between 0.886 to 1.13 Fibonacci level and from here the potential reversal zone of bullish shark starts. Now we can expect that from this PRZ level the price action can start the bullish move at any time.

Conclusion:
Even though the price action of NPXS token has formed two bullish reversal patterns therefore we can expect that the priceline will start the movement to the upside very soon. However, we should set the maximum extent of the potential reversal zone of bullish shark pattern as stop loss. Because if this support will be broken down then a more powerful rally to the downside can be started.