}
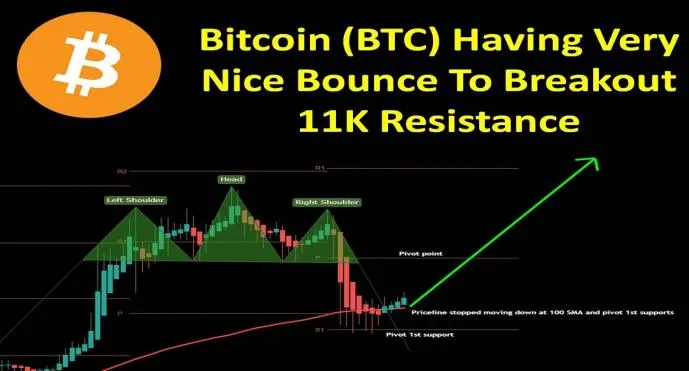
Hey, friends hope you are well and welcome to the new update on Bitcoin. In my previous article, we have seen that after the completion of the Head & Shoulder pattern the price action of BTC broke down the neckline of the Head and Shoulder and moved more down. Then the priceline of leading cryptocurrency stopped at 100 simple moving average and consolidated above this support. The candlesticks of the Bitcoin chart also spiked up to the pivot first support that is at $9900.

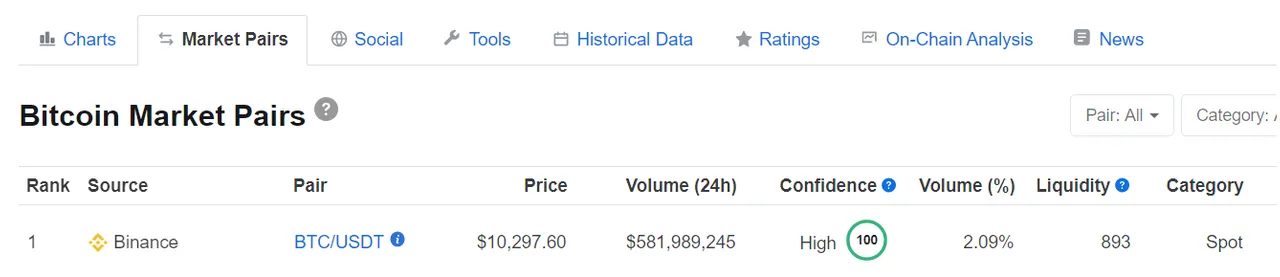
What can be the best exchange or place to buy or trade Bitcoin:
Well at this time Binance is ranked at No: 1 for Bitcoin trading with 100% confidence of traders and the largest trading volume as well, therefore I would suggest you to buy or trade BTC on Binance. If you don't have an account on Binance then click on the link or copy and paste it in your browser to create an account:
https://www.binance.com/?ref=11256882
Different indicators and oscillators:
Now I would like to again show you the different indicators and the oscillators on the daily chart. As we have already discussed that the price action is having a very nice bounce from the 100 simple moving average. Now if we watch the moving average convergence divergence (MACD) indicator then it is still turning bullish and the momentum indicator showing that the momentum is getting changed from bearish to bullish and if we take a look at the stochastic oscillator then it has given bull cross from the oversold zone.

Different support and resistance levels:
Now if we take a look at the different support and resistance levels on the daily chart then it can be observed that the price action has successfully re-tested the $10,000 support level that was previously working as resistance before August 2020. Now there are strong chances that the price action will try to break out the $11000 resistance. If we take a closer look at the daily chart then the priceline has another hurdle between $11000 and $12000 resistance levels and that is the 50 simple moving average. At the time of writing this resistance is at $11250. Therefore we can expect a rapid move up to this resistance.

Click here to create free account on tradingview to watch and play the chart on realtime
Conclusion:
As after the consolidation phase the priceline of the king of all cryptocurrencies is having a very nice bounce from the different moving averages on the daily and on the long-term charts and all the indicators on the daily chart are turning bullish. This is a very clear confirmation that the price action may try to breach the next resistance at $11,000 very soon. However, the further move to the upside depends on the indicators on the daily chart if they will be continuously turning bullish then the price action of BTC will be moved more up.