Grüßle 😀
Ab und zu kommt der Moment in dem man ein Rätsel hat, für das man Mathe braucht. Dank dCity habe ich genau so eines in der letzten Woche zumindest ansatzweise gelöst. Nämlich:
- Wie kann man mit (relativ günstigen) Obdachlosen-/Immigrantenkarten die Bevölkerung der Stadt maximieren?
Greetings 😀
Every now and then the moment comes when you have a puzzle for which you need math. Thanks to dCity I have solved one of those puzzles in the last week, at least to some extent. Namely:
- How can you maximize the population of the city with (relatively cheap) homeless/immigrant cards?
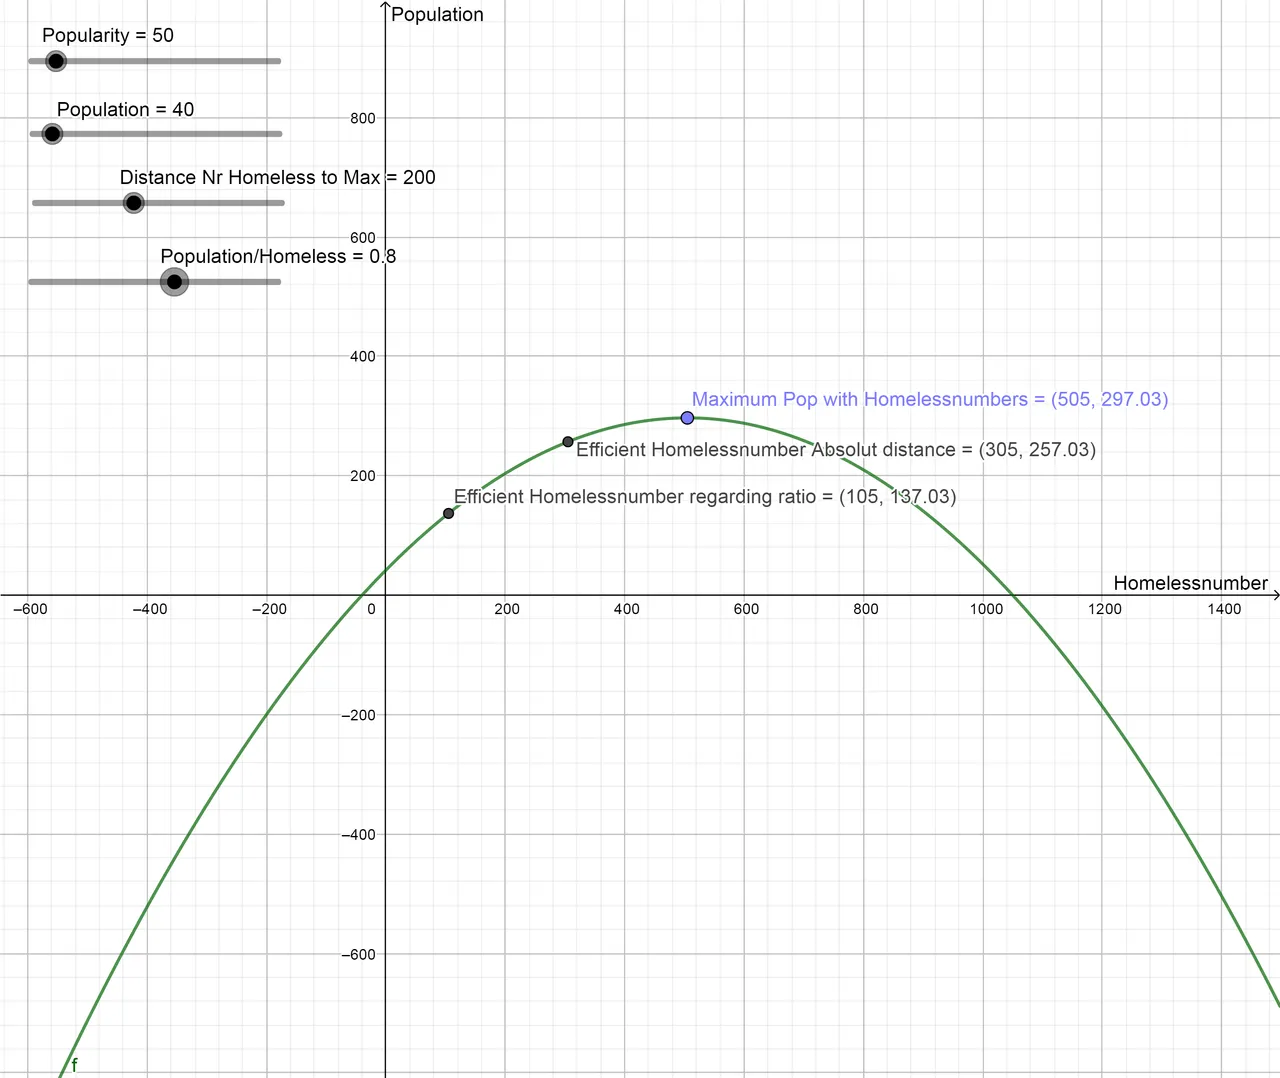
Die Funktion dazu ist relativ einfach: (Bevölkerung+x)*(1000-x+Beliebtheit)/(1000)
Bevölkerung (population) und Beliebtheit (popularity) kommen von den Gebäuden, x ist die Anzahl an Bevölkerung die von Obdachlosen+Immigranten kommt (-x ist gleichzeitig der Beliebtheitsmalus dieser Karten).
Das Bild der Funktion ist die grüne Parabel in der unteren Grafik. Das absolute Optimum an Bevölkerung ist leicht zu bestimmen; einfach die Funktion ableiten und die Nullstelle finden. "Maximum Pop with ..." mit Bevölkerung 297 und x=505.
Aber... Um zu dem Punkt zu gelangen sind die letzten (Bevölkerungs-)Meter gepflastert mit Migranten..
Würde man x um 200 reduzieren (also 100 Migranten, oder 200 Obdachlose), reduziert sich die Bevölkerung nur um 40! Siehe Efficient homelessnumber Absolut distance
The function for this is relatively simple: (population+x)*(1000-x+popularity)/(1000)
Population and popularity come from the buildings, x is the number of population coming from homeless+immigrants (-x is also the popularity penalty of these cards).
The image of the function is the green parabola in the graph below. The optimal population is easy to determine; just derive the function and find the zero point. "Maximum Pop with ..." with population 297 and x=505.
But... To get to that point, the last few meters (in population) are paved with migrants.
If you would reduce x by 200 (i.e. 100 migrants, or 200 homeless people), the population would be reduced by only 40! See Efficient homelessnumber Absolute distance
Es liegt also nahe ein anderes Optimum zu suchen.
Momentan kosten Bevölkerungspunkte durch Migranten/Obdachlosenkarten nur ungefähr ein Fünftel im Vergleich zu den Punkten durch die Häuser.
Dieses Verhältnis wird durch den Schieber "Population/Homeless" angegeben. Hat er den Wert 1, wäre die Bevölkerung durch Obdachlose gleich teuer wie durch Häuser, bei Wert 0,2 hätten wir das aktuelle Verhältnis von 1:5.
Wenn wir nun die Ableitung der Funktion in einem Punkt als lineare Annäherung der Steigerung der Bevölkerung in Verhältnis zur Steigerung der Obdachlosenzahlen sehen (Δ Bevölkerung/Δ x), können wir als gewünschtes Ergebnis genau das aktuelle Handelsverhältnis eingeben.
Zur besseren Übersichtlichkeit habe ich aber ein Verhältnis von 4:5 gewählt, siehe Efficient Homelessnumber regarding ratio
So it is obvious to look for another optimum.
At the moment, population points through migrants/ homeless cards cost only about one fifth compared to points through houses.
This ratio is given by the slider "Population/Homeless". If it has a value of 1, the population through homeless would cost the same as through houses. If it has a value of 0.2, we would have the current ratio of 1:5.
If we now see the derivation of the function in one point as a linear approximation of the increase in population in relation to the increase in the number of homeless (Δ Population/Δ x), we can enter exactly the current trade ratio as the desired result.
For better visibility, however, I have chosen a ratio of 4:5, see Efficient Homelessnumber regarding ratio.
Die Grafik wurde mit Geogebra (https://www.geogebra.org/) erstellt, einem beeindruckenden, freien CAD Programm.
Die Bevölkerungsfunktion wurde leider gestern durch die Entwickler von dCity zu 1 + (popularity^0.7)/100 abgeändert..
Ich war also zu langsam mit dem Beitrag schreiben. Vielleicht gibt es ja ein Update zur Optimierung der neuen Funktion. 🤓
The graphics were created with Geogebra (https://www.geogebra.org/), an impressive free CAD program.
The population function was unfortunately changed yesterday by the developers of dCity to 1 + (popularity^0.7)/100..
Looks like I have been too slow with the post writing. Maybe there is an update to optimize the new function. 🤓
P.S. Die Assoziation von Obdachlosen/Immigranten mit negativer Beliebtheit ist Teil des Spiels, nicht meiner persönlichen Einstellung.
P.S. The association of homeless/immigrants with negative popularity is part of the game, not my personal attitude.

The article was translated with the help of https://www.deepl.com/