Hi Everyone,

Welcome to the Spectrumecons 7 Week Challenge. During the months of July and August, I will be running an economics challenge series. This series will consist of 7 challenges. Some of these challenges will be familiar to my followers, while others will be completely different to any previous challenges or contests I have run.
Each challenge will reward winners with as much as 60 Hive. The value of the prize will depend on the level of participation. For each new participant, the prize will increase by 5 Hive. This will continue until 60 Hive is reached (12 participants). The first 12 participants will also receive a 50% upvote from this account. In addition to the prize money, the top few participants will be given points. These points will be used to determine the overall challenge series winner. This winner may receive as much as 80 Hive. The value of the prize will equal the sum of the number of participants across all challenges. This will continue until 80 Hive is reached.

For more information on the challenge series and the upcoming challenges, read my post Spectrumecons Seven-Week Challenge (Coming Soon).
Other Challenges in the Series
Welcome to Challenge 3: Cost Benefit Analysis
How to Play?
The Cost Benefit Analysis (CBA) challenge requires participants to make investment decisions for several communities using an allocated budget. These decisions will be assessed based on Net Present Value (NPV). The participant with the highest NPV will win the challenge.
CBAs can be complicated and require considerable amount of analysis. This challenge involves only very basic analysis using very limited data and basic assumptions. Most data provided will relate to growth rates, population breakdown, capacity of existing facilitates, costs of overcapacity, and cost of investment. Participants need to consider the scenario without investment (base case) and use it to compare against the scenario with their chosen investments (project case). Assumptions will relate to links between data and costs. Participants will need to consider the data and assumptions in order to make better investment decisions. All the information you need to know to play the game is provided in the question; i.e. no external research is required as all data and assumptions are hypothetical.
All entries must be made in the comments section of this post.
Each account is only permitted one entry.
Objectives of the game
The objective of the game is to obtain the highest NPV based on investment decisions made. If two or more participants have the exact same NPV, the participant that entered first wins.
Game assumptions
- All assets are assumed to have a life of 20 years.
- The base case, is assumed to be a do nothing scenario (infrastructure and amenities remain unchanged but is subject to growth in population)
- The project case has no ongoing costs such as maintenance costs (i.e. assets do not deteriorate) or additional pay for increased staff (i.e. assumed not required). This has been done to greatly simplify the analysis.
- All investment requires just one year for implementation (i.e. completed at the end of Year 0/ beginning of Year 1).
- Tourism growth is assumed to affect entertainment venues only.
- Investment costs are not discounted as they are all assumed to occur in Year 0.
- Population growth applies across all areas (e.g. 5% population equates to 5% increase in No. sick people).
- Population growth will be treated as linear (e.g. 5% growth is based on initial values and not compounded).
- Benefits are calculated as reduction in user costs (base case user costs – project case user costs).
- There is no induced demand (i.e. upgrades will not influence population growth rates).
What information is provided?
- All locations (cities and towns) are provided.
- All investment options are provided.
- Capacities of existing venues and infrastructure are provided.
- Percentage of usage of venues and infrastructure for children, adults, and elderly are provided.
- Exact percentage population growth rates for children, adults, and elderly are not provided. Instead, a min and max growth rate is provided in the question. A model will be used to determine the growth rate using a uniform distribution. The same is done for growth in tourism.
- Costs of reaching excess capacity are provided.
- Costs of all infrastructure initiatives for all towns and cities are provided in the question.
Formulae used to calculate costs and benefits
Cost of hospitals over capacity = % Over Capacity × Current Capacity (patients) × Probability of Death × Value of Life × 6 months (0.5 Year)
Note: Calculate for both winter and summer.
Cost of high schools over capacity = % Over Capacity × 100 × Cost per child × No. Children
Cost of transport over capacity = % Over Capacity × 100 × Cost per passenger × No. Passengers
Cost of entertainment over capacity = % Over Capacity × Current Capacity (patrons) × Cost of missing entertainment × 365
Benefits = Costs of over capacity (Base Case) – Costs of over capacity (Project Case)
How are the results of the game determined?
A Microsoft Excel Model is used to determine the population growth rates for children, adults, elderly, and tourists. These growth rates will be applied to the formulae described in the previous section. NPV will be determined based on each participant’s investment decision. The results post will contain a video of the generation of all of the above. The winner will be announced in both the video and written post.
Contest Prizes
The account with the winning entry may receive up to 60 Hive. The number of participants determines the value of the prize. For every entry, the prize is increased by 5 Hive until a value of 60 Hive is reached. The first 12 entries will be given upvotes. The winner of this challenge will be given 40 points, second place 10 points, and third place 5 points. These points will be tallied at the end of the challenge series to determine the overall winner.
Let the challenge begin
Participants have been allocated a budget of $10 Billion to invest in as many investment initiatives as possible across four different towns. These towns and cities are as follows:
- Wheat Town
- Corn Town
- Grain City
- Rice Town
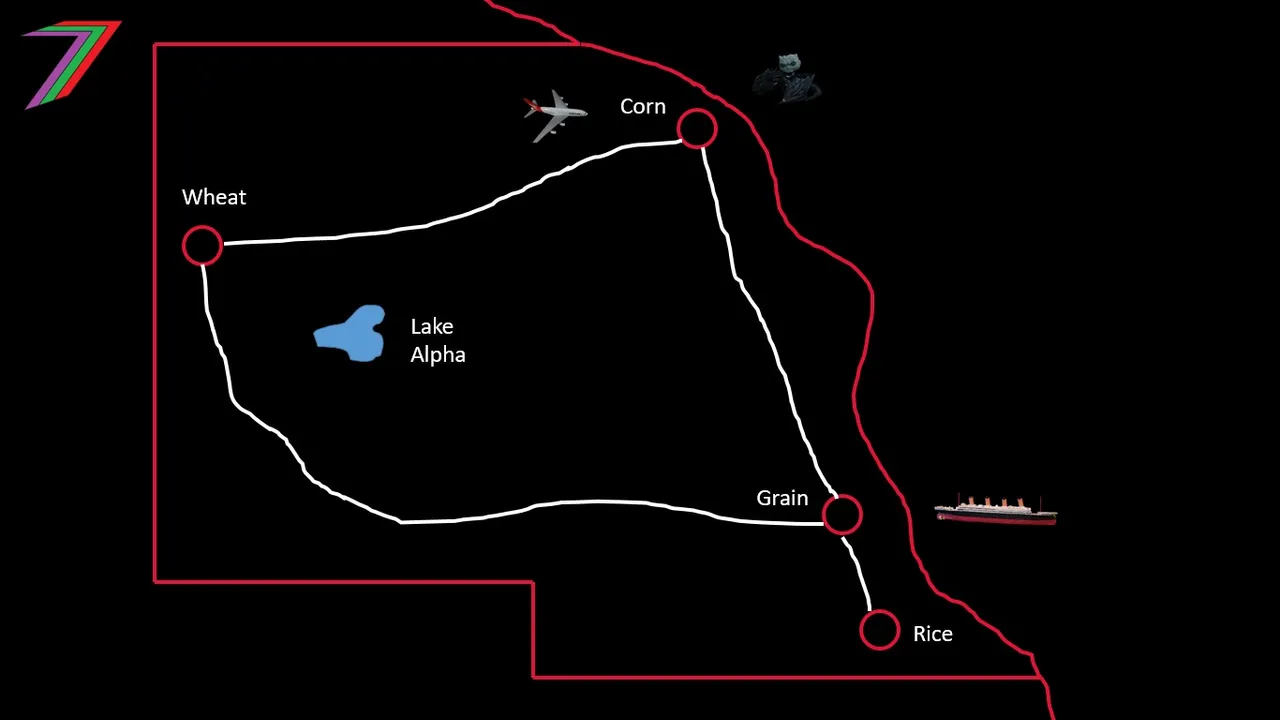
Below is a map of the location of the towns.
Locations of Towns and City
Game Data
Tables 1 and 2 contains data for towns, infrastructure and amenities.
Table 1: Population Growth and Hospital Data
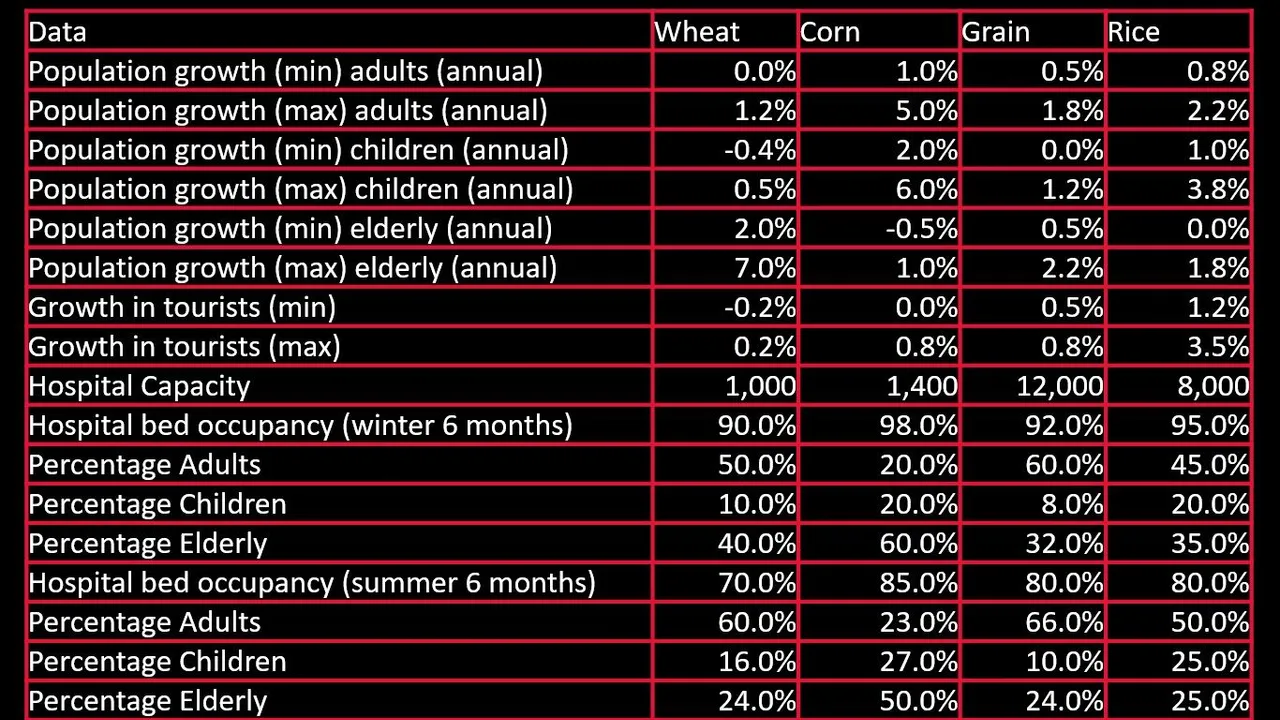
Table 2: High School, Public Transport and Entertainment Data
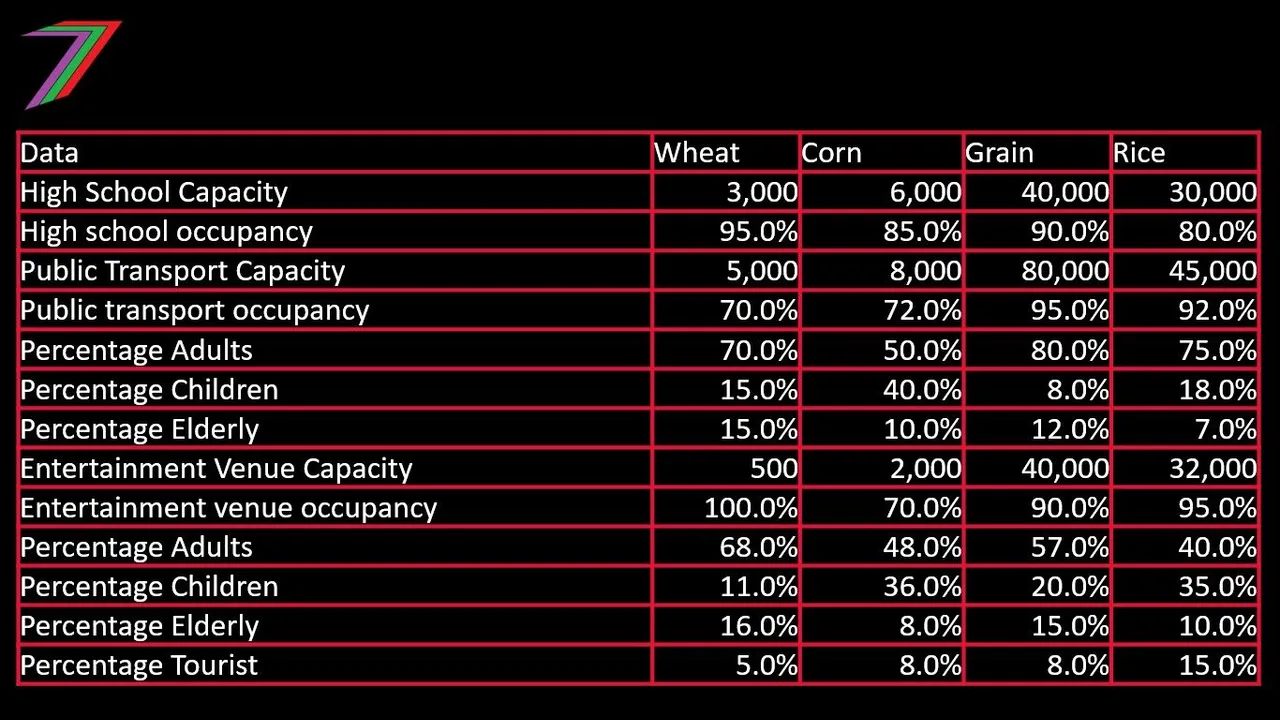
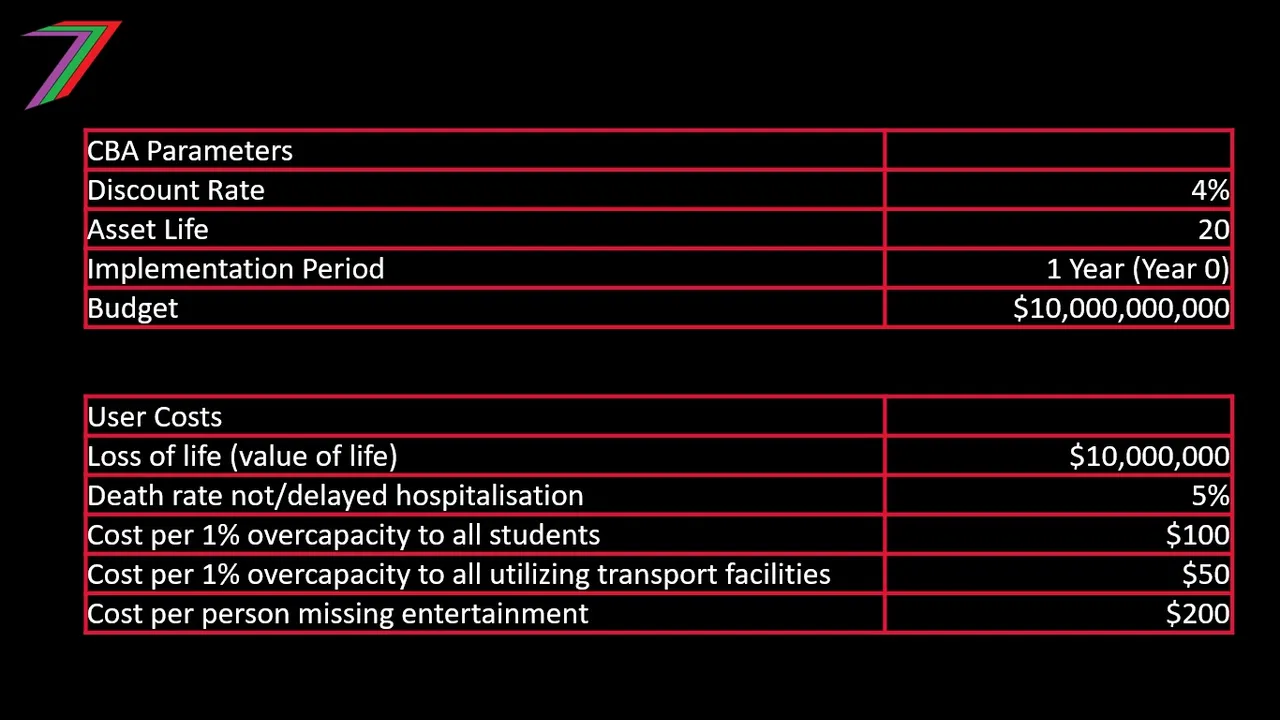
Table 3 contains CBA parameters and user cost parameters.
Table 3: CBA Parameters and User Costs
Investment Options
Participants have four different types of investment options. These relate to hospitals, schools, transport, and entertainment. Participants can investment in one, some, or all of the towns and cities stated in the question. Participants can choose to between four levels of investment. They can increase capacity by 5%, 10%, 20%, or 50%. These increases in capacity are permanent across all 20 years of the evaluation. Table 4 contains the investment options and costs of investment for each town and city.
Table 4: Investment Options and Costs
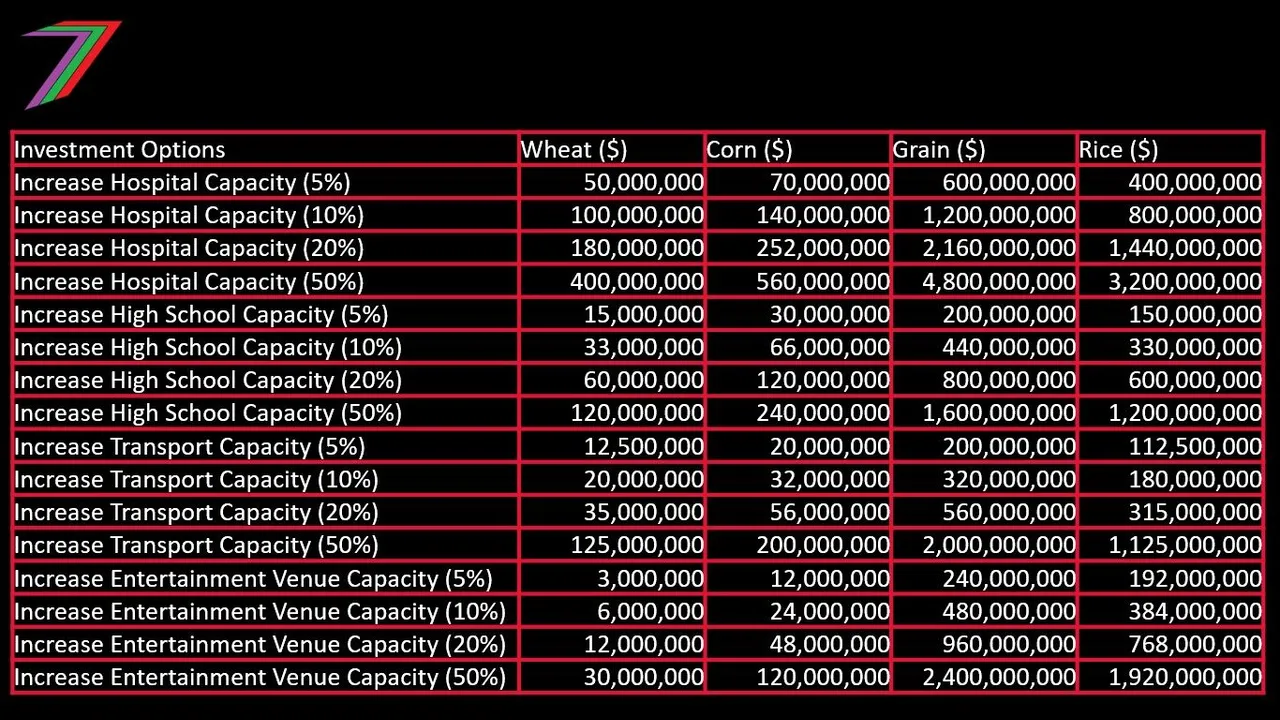
Important Note: You are not required to spend the entire budget. If you feel your investment proposals are sufficient (i.e. additional expenditure would reap a lower return), you should opt not to continue investing.
Entry format
For this challenge, I expect to see entries made in the following format:
Name of Place:
Investment 1:
Investment 2:
….
Name of Place:
Investment 1:
Investment 2:
….
Name of Place:
Investment 1:
Investment 2:
…
Name of Place:
Investment 1:
Investment 2:
…
Example of entry
Name of Place: Wheat Town
Investment 1: Increase Hospital Capacity (20%)
Investment 2: Increase High School Capacity (20%)
Investment 3: Increase Entertainment Venue Capacity (50%)
Name of Place: Corn Town
Investment 1: Increase Hospital Capacity (50%)
Investment 2: Increase High School Capacity (5%)
Investment 3: Increase Transport Capacity (20%)
Name of Place: Grain City
Investment 1: Increase Hospital Capacity (20%)
Investment 2: Increase High School Capacity (10%)
Investment 3: Increase Transport Capacity (20%)
Investment 4: Increase Entertainment Venue Capacity (10%)
Name of Place: Rice Town
Investment 1: Increase Hospital Capacity (50%)
Investment 3: Increase Transport Capacity (20%)
Investment 3: Increase Entertainment Venue Capacity (50%)
The closing date and time for this challenge is 6PM coordinated universal time (UTC) 20/07/2021. Responses after this time will not be accepted. The answers will be provided in the results post along with the video containing the generation of growth rates, the calculation of benefits and costs, and the NPV.
I hope everyone has fun and enjoys this third challenge. I look forward to your participation in the fourth challenge.
More posts

If you want to read any of my other posts, you can click on the links below. These links will lead you to posts containing my collection of works. These 'Collection of Works' posts have been updated to contain links to the Hive versions of my posts.
My CBA Udemy Course
The course contains over 10 hours of video, over 60 downloadable resources, over 40 multiple-choice questions, 2 sample case studies, 1 practice CBA, life time access and a certificate on completion. The course is priced at the Tier 1 price of £20. I believe it is frequently available at half-price.
Future of Social Media


