Hi Everyone,
Welcome to the ‘Buying and Selling’ Game Christmas 2021 Edition
Another year is coming to a close and Christmas is on our doorsteps once again. For this Christmas, I am running the Buying and Selling Game a little differently. I am using the business version of the game to create two options for our participants. Participants can choose between buying and selling candies or buying and selling toys. The person who makes the highest profit selling candies will win 20 Hive. The person who makes the highest profit selling toys will win 20 Hive. The person who makes the highest profit overall will win an additional 10 Hive on top of the 20 Hive they have already won.
For more information regarding the business version of the Buying and Selling Game. Watch and/or read the following posts and videos.
- Buying and Selling Game (Business Version) Explanation Video
- Contest 19
- Contest 21
- Contest 23
- Challenge 6
How to play?
The ‘Buying and Selling’ Game Christmas 2021 Edition involves three simple steps.
- Choose between buying candy or toys
- Choose the quantity of each type of candy or toy you want to buy.
- Choose the selling price of each type of candy or toy.
All the information you need to know to play the game is provided in the question; i.e. no external research is required as all costs and demand estimates are hypothetical.
All entries must be made in the comments section of this post.
Each account is only permitted one entry.
Objective of the game
The objective of the game is to make the highest profit from the sale of either candy or toys. If two participants make the exact same profit, the participant that entered first wins.
Game assumptions
Both candy and toys have 100 potential customers. Each customer can buy up to 6 packets of candies or 5 toys if he or she values the candies or toys above the selling price (i.e. has a willingness-to-pay higher than the selling price). Each customer is only interested in one type of candy or toy. Therefore, selling more types of candies or toys increases the potential number of customers. For example, selling three types of toys grants access to 300 potential customers.
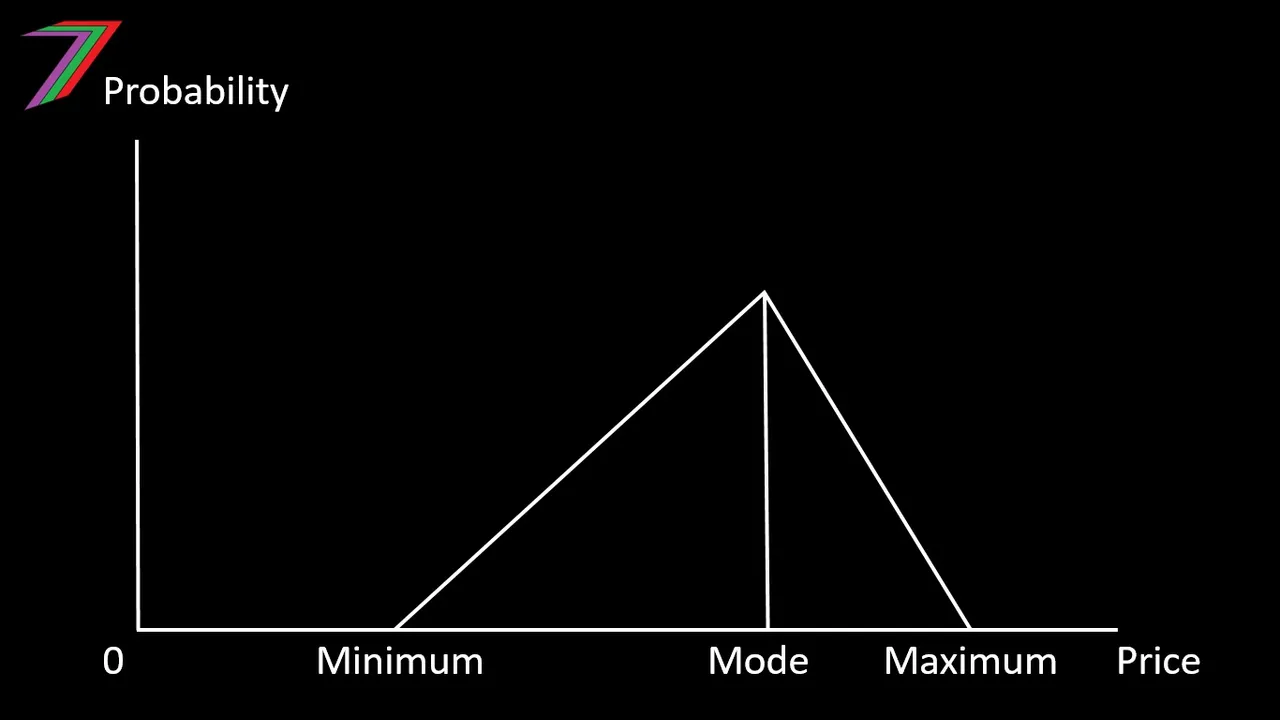
Demand for the candies or toys for each customer is determined using triangle distributions. The question provides the minimum, maximum, and mode willingness-to-pay for each type of candy or toy. Demand is further adjusted for diminishing marginal utility using a fixed percentage adjustment. The demand curve is the summation of demand of all potential customers. See an example of a triangle distribution below. A sample demand curve is shown later in the post.
Selling Price Distribution
Each customer has diminishing utility (diminishing willingness-to-pay as more candies or toys are bought) for each candy or toy. For example, a customer may have a willingness-to-pay of $10.00 for the first plush toy, $8.00 for the second plush toy, $6.00 for the third plush toy, $4.00 for the fourth plush toy, $2.00 for the fifth plush item, and $0.00 for the sixth plush toy. The question will state this diminishing utility as 20% (i.e. 2/10 = 20%), which is applied linearly. If a participant prices the plush toy at $5.00, the customer will buy three plush toys, as the customer values the fourth plush toy below $5.00 (i.e. $4.00).
The business will have overhead costs, which need to be deducted from the budget before candies or toys can be bought. There are zero transaction and transport costs.
If some candies or toys remain unsold, they will be treated as being wasted, which is equivalent to being sold for $0. This could occur if a participant prices the candies or toys too high.
What information is provided?
- All the candies or toys that can be bought in the game are provided.
- All costs (i.e. costs to buy candies or toys and overhead costs) are provided.
- Any special purchasing requirements are provided. For example, the candies or toys may need to be bought in fixed quantities.
How are the results of the game determined?
A Microsoft Excel Model is used to determine the demand of each candy and toy. The costs, quantities bought, quantities sold, and prices will be used to calculate the profits made by each participant. In the results post, the calculation of the demand and profits from selling candy and toys will be presented in a video.
Contest Prizes
The account with the highest profit from selling candies will receive 20 Hive and the account with the highest profit from selling toys will receive 20 Hive. The account that makes the highest overall profit from selling either candies or toys will receive an extra 10 Hive on top of the 20 Hive they have already won. The first 12 entries will be given upvotes.

Let the contest begin
The participants must choose between running a candy shop or a toy shop.
Candies
If the participant chooses to run a candy shop, he or she can sell three types of candies.
- Chocolates
- Toffees
- Jellies
The participants will only be able to purchase chocolates and toffees in batches of 20 bags and jellies in batches of 30 bags. The costs of purchasing each batch, the average cost per candy and daily overheads are provided in the tables below.
Cost Information (Candy)
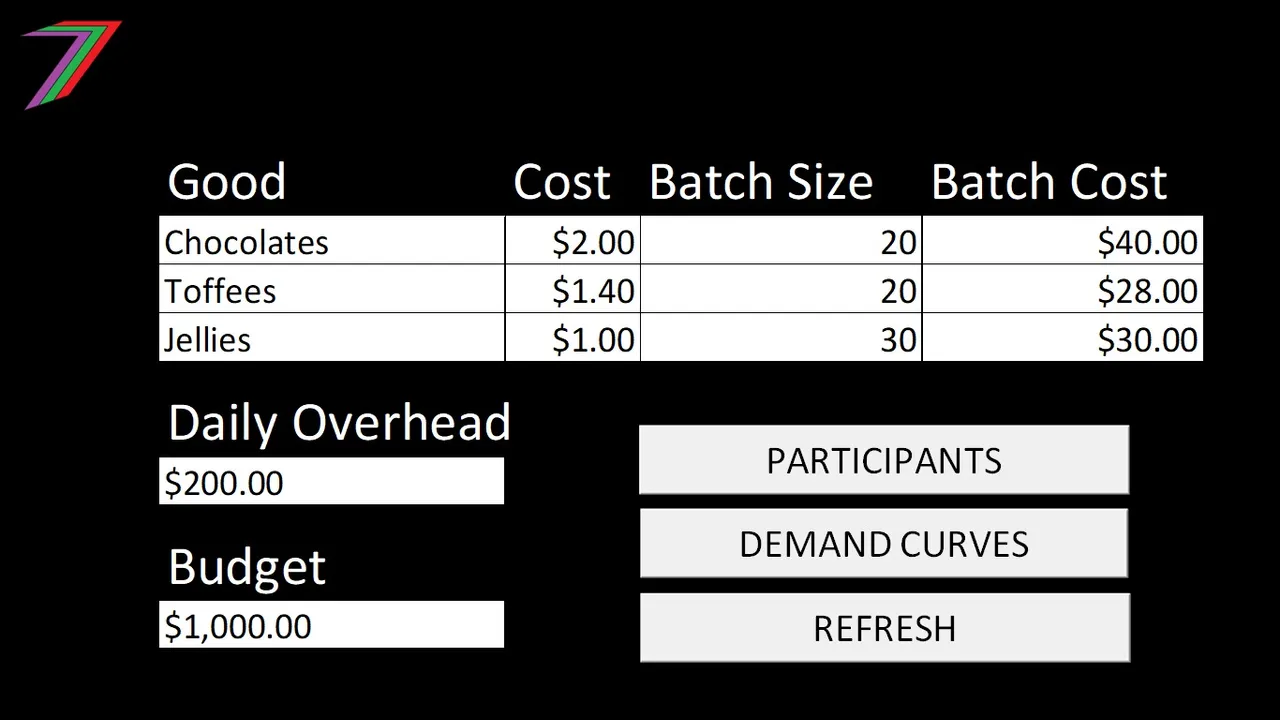
Note: Budget includes Daily Overhead. If the budget is $1,000 and the daily overhead is $200, there is $800 remaining to purchase candies.
The parameters to determine demand are provided in the table and graphs below.
Demand Information (Candy)
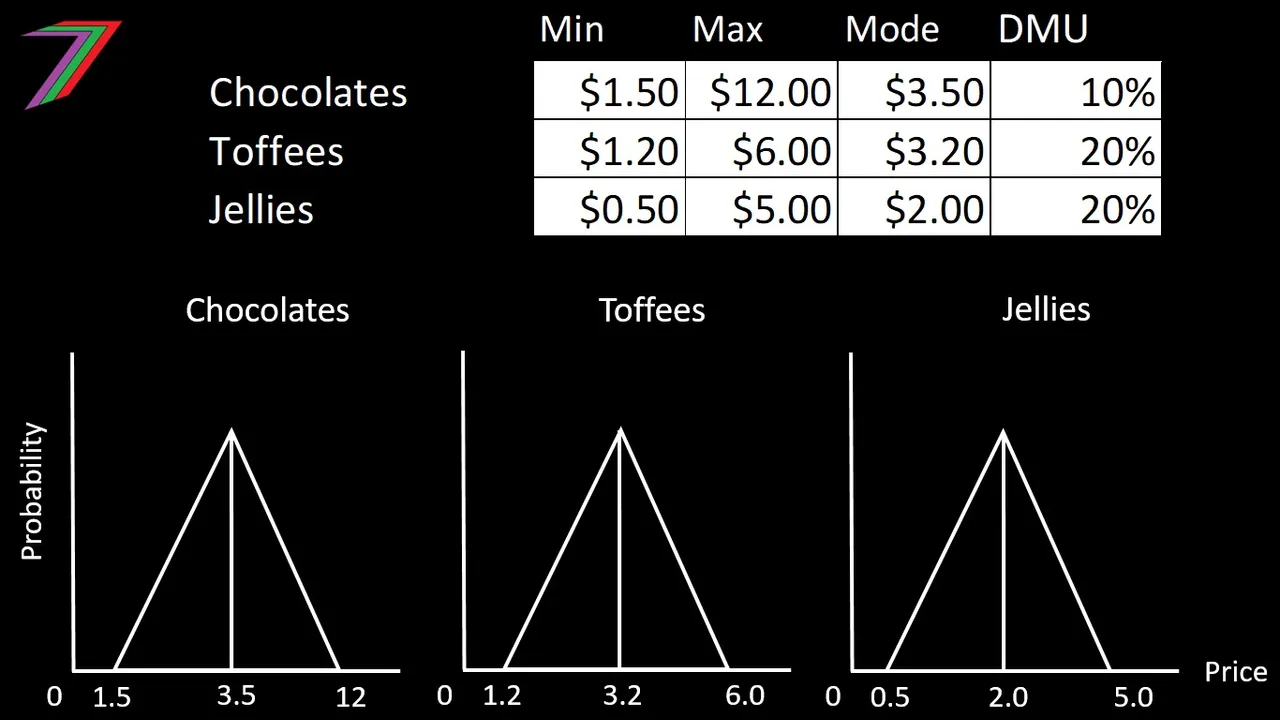
Note: The graphs for the triangle distribution are based on the minimum, maximum, and mode prices for the first candy a customer buys. The demand curve is adjusted to include diminishing utility expressed in the last column of the table. This will affect the elasticity of demand.
It has been assumed each type of candy has 100 potential customers. Each customer will potentially buy a maximum of 6 candies. Therefore, it is possible a maximum of 600 of each candy could be sold. The Figure below contains a sample of a possible demand curve that could be generated by the model using the parameters described in this question.
Possible Demand Curve (Candy)
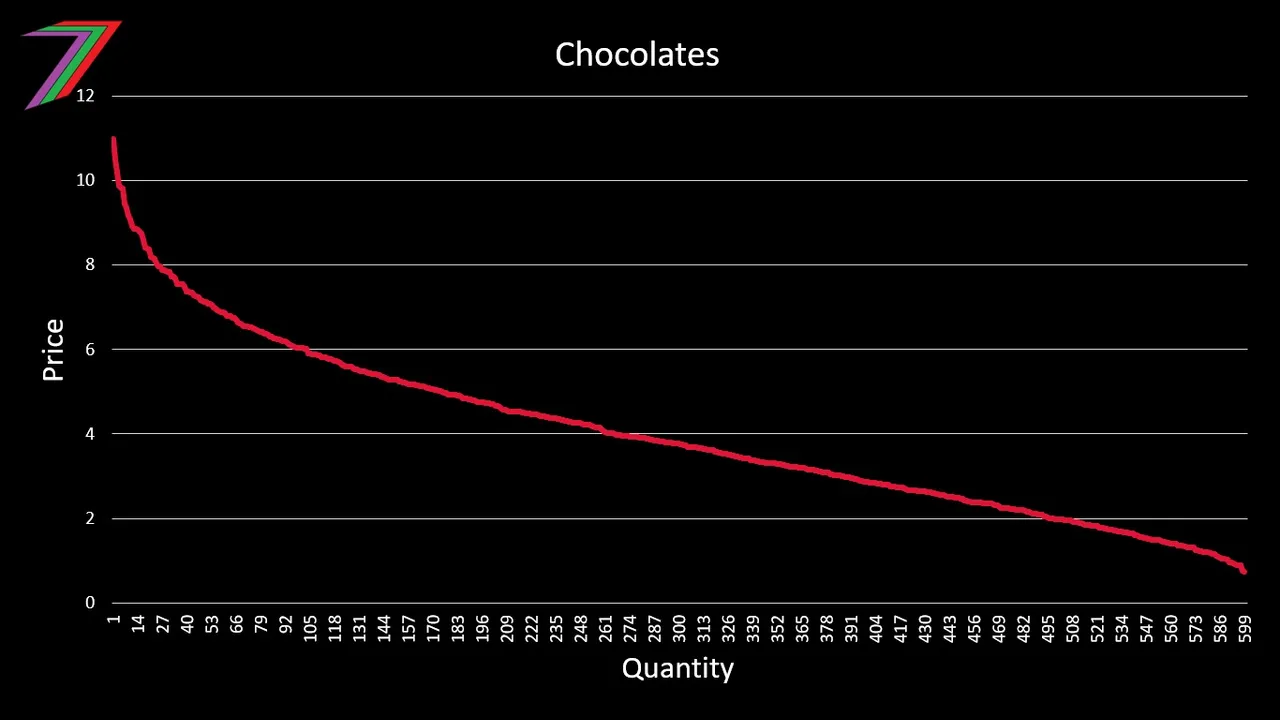
Note: Sample demand curve for chocolates. Actual demand curve will be determined in the results post.
Toys
If the participant chooses to run a toy shop, he or she can sell three types of toys.
- Plush Toys
- Robots
- Bobbleheads
The participants will only be able to purchase plush toys and bobbleheads in batches of 10 and robots in batches of 5. The costs of purchasing each batch, the average cost per toy and daily overheads are provided in the tables below.
Cost Information (Toys)
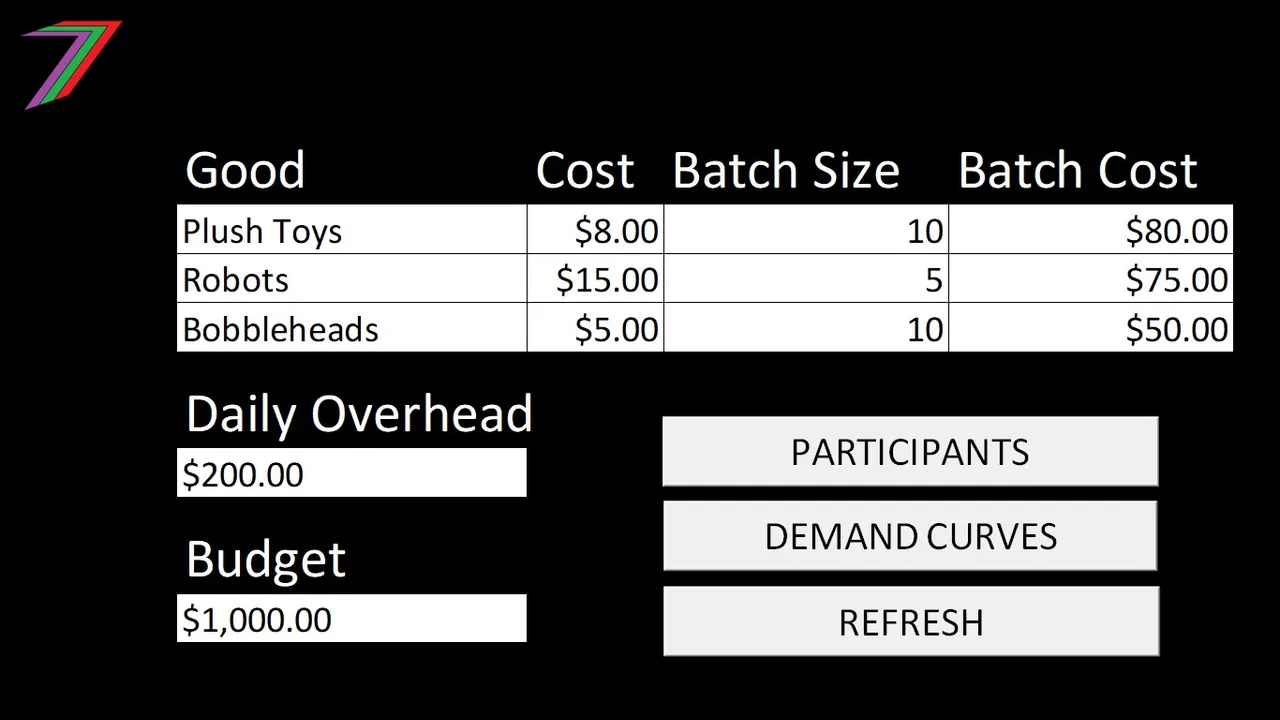
Note: This is the same budget as for candies.
The parameters to determine demand are provided in the table and graphs below.
Demand Information (Toys)
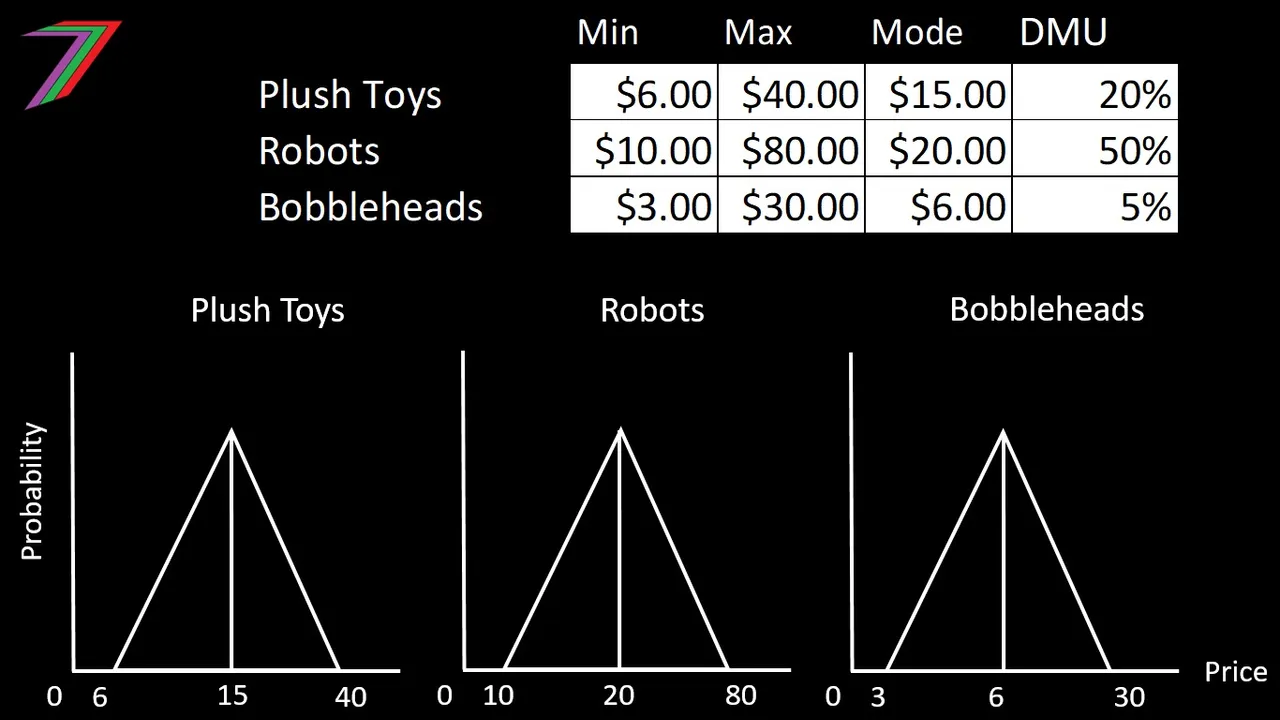
Like with the candies, it has been assumed each type of toy has 100 potential customers. Each customer will potentially buy a maximum of 6 toys. Therefore, it is possible a maximum of 600 of each toy could be sold. The Figure below contains a sample of a possible demand curve that could be generated by the model using the parameters described in this question.
Possible Demand Curve (Toys)
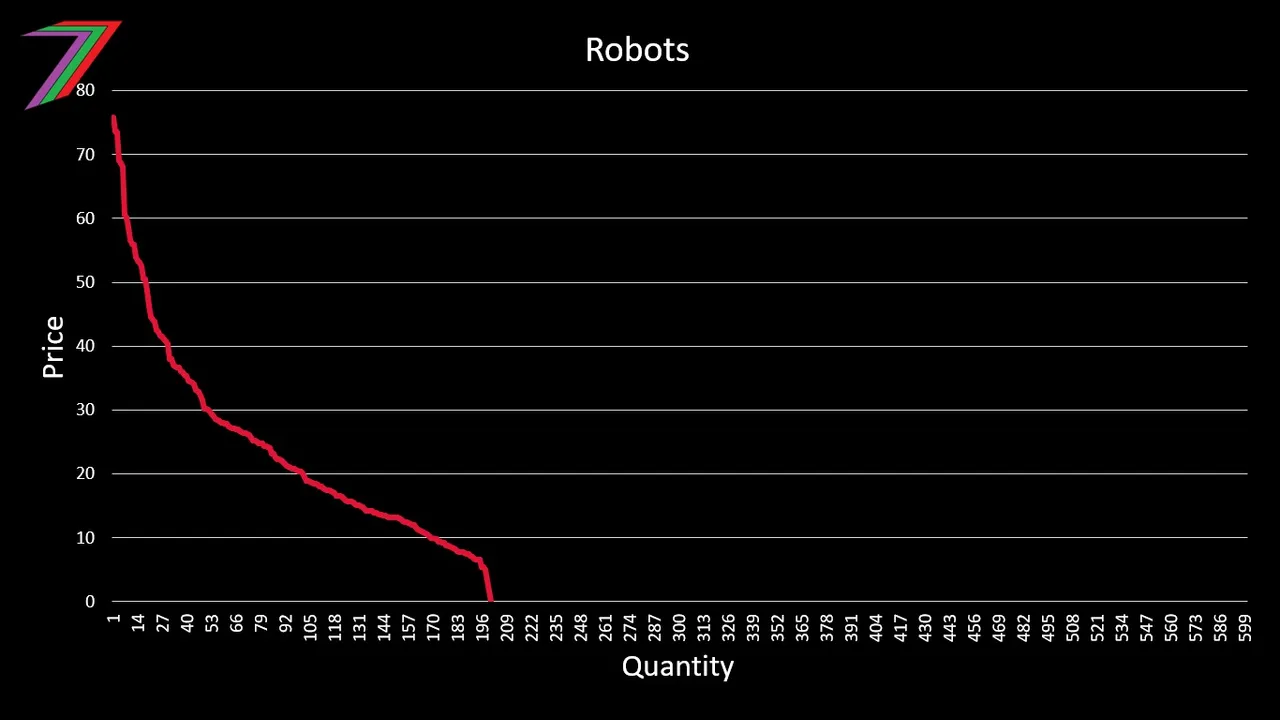
Note: Sample demand curve for robots. Actual demand curve will be determined in the results post.
Entry format
For this contest, I expect to see entries made in the following format:
Candies or Toys:
Chocolates or Plush Toys
Quantity: XXX Selling Price: XXX
Toffees or Robots
Quantity: XXX Selling Price: XXX
Jellies or Bobbleheads
Quantity: XXX Selling Price: XXX
Example 1:
Candies or Toys: Candies
Chocolates
Quantity: 200 (10 batches) Selling Price: $5
Toffees
Quantity: 60 (3 batches) Selling Price: $4
Jellies
Quantity: 300 (10 batches) Selling Price: $1.20
Example 2:
Candies or Toys: Toys
Plush Toys
Quantity: 50 (5 batches) Selling Price: $22
Robots
Quantity: 20 (4 batches) Selling Price: $45
Bobbleheads
Quantity: 20 (2 batches) Selling Price: $22
The closing date and time for this contest is 6PM coordinated universal time (UTC) 24/12/2021. Responses after this time will not be accepted. The answers will be provided in the results post along with the video containing the generation of demand and profits using the model.
I hope everyone has fun and enjoys the 2021 Christmas Edition of the contest. If you have any questions, feel free to ask in the comments section.
More posts
If you want to read any of my other posts, you can click on the links below. These links will lead you to posts containing my collection of works. These 'Collection of Works' posts have been updated to contain links to the Hive versions of my posts.
My CBA Udemy Course
The course contains over 10 hours of video, over 60 downloadable resources, over 40 multiple-choice questions, 2 sample case studies, 1 practice CBA, life time access and a certificate on completion. The course is priced at the Tier 1 price of £20. I believe it is frequently available at half-price.
Future of Social Media