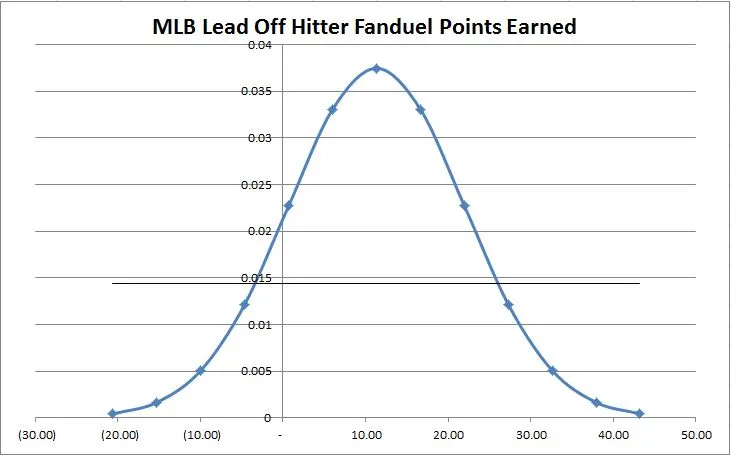
Today, we’ll use my limited data set to look at the number one hitter in a MLB lineup, and the points earned. Why start with the leadoff hitter? For starters, the leadoff hitter will get the most plate appearances per game. If the manager of the team is any good, the manager will put a player in that spot that gets on base more times than not. Why? Well runs, of course…a team needs runs scored to win. The more often a leadoff hitter gets on base, the better the probability that leadoff hitter will score with bats number two, three, and four behind him.
That’s the theory, at least.
If we return to this chart:
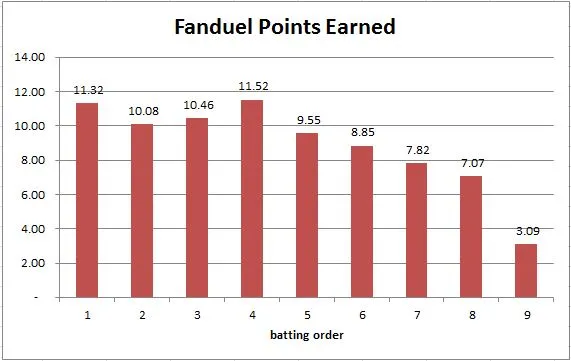
We see that the MLB hitter hitting in the number one spot earns the second most points per game at 11.32 points/game average. That’s not bad. Yet, I’m curious if we can see if there is any correlation between how a) bad the starting pitcher is and b) bad the opposing team’s bullpen is. We return to FIP, or the fielding independent pitching statistic.
A Team FIP Estimation

Every day, I write down a starting pitcher’s FIP into a spreadsheet. The math above looks complicated, but all it's really attempting to do is figure out what a pitcher is ultimately responsible for, independent of fielding. The pitcher is ultimately responsible for a) striking someone out, b) walking someone, c) given up a home run, and d) hitting a batter.
I also write down each team’s updated bullpen FIP each day into the spreadsheet. I then used a weighted average to calculate what that team’s pitching FIP will be each day.
For example, last night, Brandon Woodruff started for my beloved Milwaukee Brewers. His FIP, prior to last night’s start, was 2.98 xFIP. That’s pretty good for a MLB starting pitcher. The Brewer’s bullpen, however, has a 4.28 xFIP. That isn’t so good. This part is easy enough and straightforward, but how do I come with a team FIP?
I’m lazy; I have played with statistics long enough to know there is a certain payback for generating a level of detail of statistics. Sometimes it is worth it, other times not so much. So for this example, I began with my limited data set to come up with weights.
I have tracked, so far, 1830 2/3rds innings pitched so far. Of that, starters have pitched 1086 2/3rds of that. So I then use a weight for starting pitchers of .59; relief pitchers get a weight of .41.
With that assumption in place, I can calculate the Brewer’s total team pitching FIP by doing the following:
2.98 x .59 = 1.75
4.28 x .41 = 1.74
1.75 + 1.74 = 3.49
It’s not perfect or complicated, but it’s something. I then took the team FIPs and compared it against the opposing team’s lead off hitter’s points earned, and broke things down into quartiles, yet again:
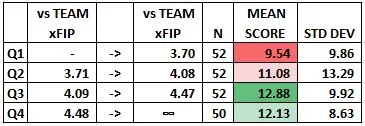
No surprise (I didn't run any t-tests, however), but at a high level, the results makes sense. Focus on lead off hitters against team's with poor xFIP totals. I plan to use this going forward.
Last Night's Results
So how did I do last night? Ok; I just barely squeaked into placing in a 50/50. No luck on the GPP, as I placed well out of the money. That gives me a total winnings value of $2 USD, or a 16.67% return.
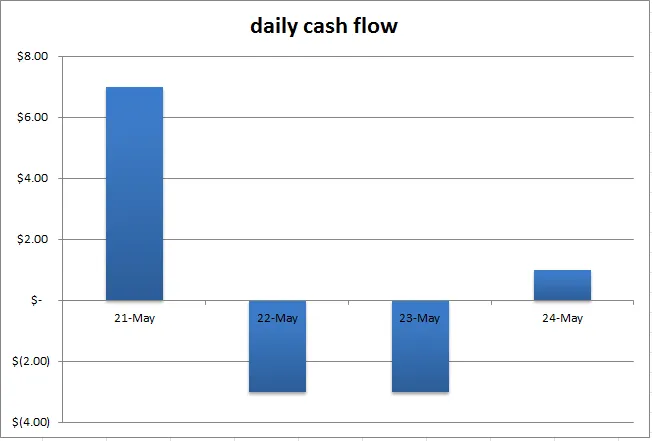
I'm definitely not going to retire any time soon, but it's fun. If I can breakeven and keep learning, I'm all for it. Maybe it will even let me buy some High Life for my next Brewers outting I get to watch on my couch.