
We all have some type of immediate and extended family. I am guessing the last time you had a full family and friends roundtable was Thanksgiving. Maybe you celebrate more holidays with big family reunions, and maybe not. When you do, they probably do not want to hear about the gold or silver markets unless someone pops the question. Then, as you attempt to explain market dynamics, more often than not, blank stares take over and they cannot wait until you are done so they can get on with food and football or baseball. If you are lucky enough to have some folks with a genuine interest, roadblocks still surface because most well-intentioned, wonderful people have no clue about where their money came from, why shrinkflation is causing the holiday meal to cost so much more, or why the price of gas is above or below three bucks a gallon. Uncle Joe waits patiently as you answer his question about gold or silver. The moment you are done, here it comes… “But why has silver been stuck below $20 for so long and gold not been above $1,400 since 2013?” Note the facial expressions in my headline photo today. Do you really think they will believe you? I totally understand.
Here are a few choice articles on fundamentals, then a technical analysis on the mining stock market.
The World Is Running Out of Gold Mines – How Investors Can Play It_… “If you look back to the 70s, 80s and 90s, in every one of those decades, the industry found at least one 50+ million ounce gold deposit, at least ten 30+ million ounce deposits and countless 5 to 10 million ounce deposits. But if you look at
the last 15 years, we found no 50 million ounce deposit, no 30 million ounce deposit and only very few 15 million ounce deposits.” – Pierre Lassonde, U.S. Global Investors, Nov. 2017_


South Africa**** Mines Output Shrinks Most in Two Years in March_… “
Gold production plummeted 18 percent, the most since January 2015 and a sixth straight month of contraction. Aging infrastructure, reserve depletion and accidents have raised costs and curbed output in South Africa, once the world’s biggest gold producer. Mining companies came under added pressure late last year and in the start of 2018 from the stronger rand and have responded by closing shafts and cutting thousands of jobs in a labor-intensive industry. ‘The story of recovery in the sector remains a fairy tale; it’s wishful thinking,’ Peter Major, a mining analyst at Cadiz Specialized Asset Management in Cape Town, said by phone. ‘We are going to continue down on this path in platinum and gold mining.’” – Bloomberg, May 10, 2018_
The World Wants Its Gold Back From the U.S.… “We’re all familiar with the so-called ‘run on the bank.’ What’s different is that the run on the bank involves gold, not cash. The New York Fed will never run out of cash because they can print all they need. But they could run out of gold.” – Jim Rickards, Daily Reckoning, Apr. 30
This Billionaire Has Put Half His Net Worth Into Gold… “Some big investors see warning signs ahead for markets but are holding their positions. Egyptian billionaire Naguib Sawiris is taking action: He’s put half of his $5.7 billion net worth into gold.” – Bloomberg, May 1

_Short the Whole Fing Thing – Going Long Gold – Why I Have No Faith in Monetary Policy _*– Chris Irons, Quoth the Raven Research Presentation Slides – May 3

Chinese gold demand way up in April_… “Despite the latest analysis from the World Gold Council (WGC) which suggested a poor start to the year for gold demand. Chinese demand as represented by gold withdrawals out of the Shanghai Gold Exchange (SGE) appear to have picked up in April coming out at 28
% higher than in 2017 and 24% higher than in 2016 (see table). They are
still around 9% down on the record 2015 figure for the first four months of the year.” – Lawrie Williams, Sharps Pixley, May 5_
North American gold ETF inflows at highest since September 2017_… “as a U.S.-China trade war stand-off, tensions over Syria and worries over possible U.S. sanctions on Russia ushered in safe-haven purchases.
This happened amid a strong U.S. dollar and expectations for the U.S. Federal Reserve to increase interest rates. North American gold-backed ETFs rose 43.7 tonnes worth $1.9 billion in April, a 3.4 percent increase from the month prior, the World Gold Council said on Wednesday. European gold-backed ETF holdings increased by 27.1 tonnes worth $1.2 billion during the same period, after two consecutive months of outflows.” – Mining.com, May 10_
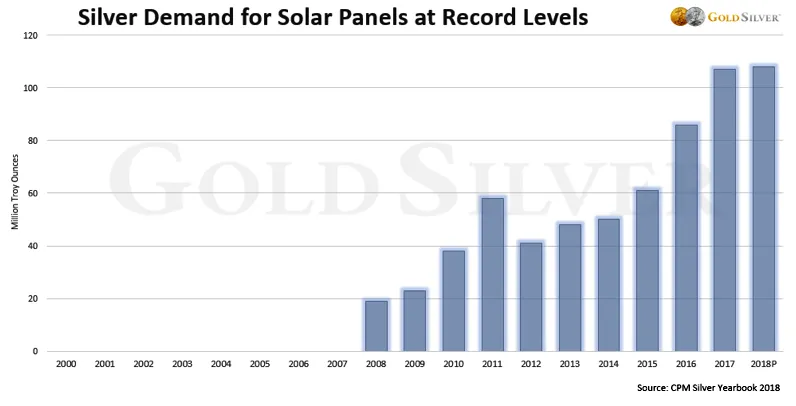
California**** Becomes First State to Order Solar Installations on New Homes_ – Bloomberg, May 9_
A silver chart-fest about current supply and demand dynamics…
The Coming Silver Supply Crunch Is Worse Than You Know_ – Jeff Clark, GoldSilver.com, Apr. 30_
In my recent article “The Good, The Bad, and The Ugly for Silver,” I briefly mentioned the upcoming solar panel demand from Saudi Arabia that will impact silver demand. Keith Neumeyer touches on solar panel growth overall in the following interview, and I include this chart from Jeff Clark’s article to add perspective…
Impending Revaluation Of Gold And Silver – Keith Neumeyer and Bill Murphy_ – CrushTheStreet, May 3_

On to the charts. To view a larger version of any chart, right-click on it and choose your “view image” option.
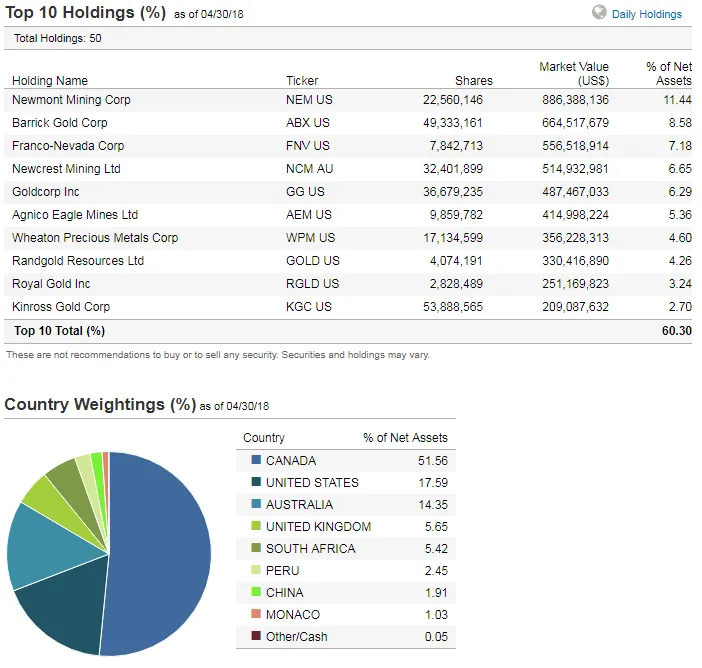
GDX VanEck Vectors Gold Miners ETF: full list of mining stocks in the basket as of April 30.
GDX weekly as of May 10, 2018 close…
From my** January 12, 2018 **analysis: “The price has breached the topside trendline drawn down from 2011… Near-term targets are the topside trendline of the Ascending Triangle and next resistance at the overhead 200 **
Exponential Moving Average **
(EMA). The DMI-ADX looks a bit sloppy, and the StochRSI is positive, but toppy. On the positive side, volumes have been rising for 3 weeks alongside the price. **
I am Neutral here**
until the 200 EMA is breached decisively, despite the bullish feeling this week’s Hammer Candle gives, and the DMI-ADXmust take on a more bullish appearance.”
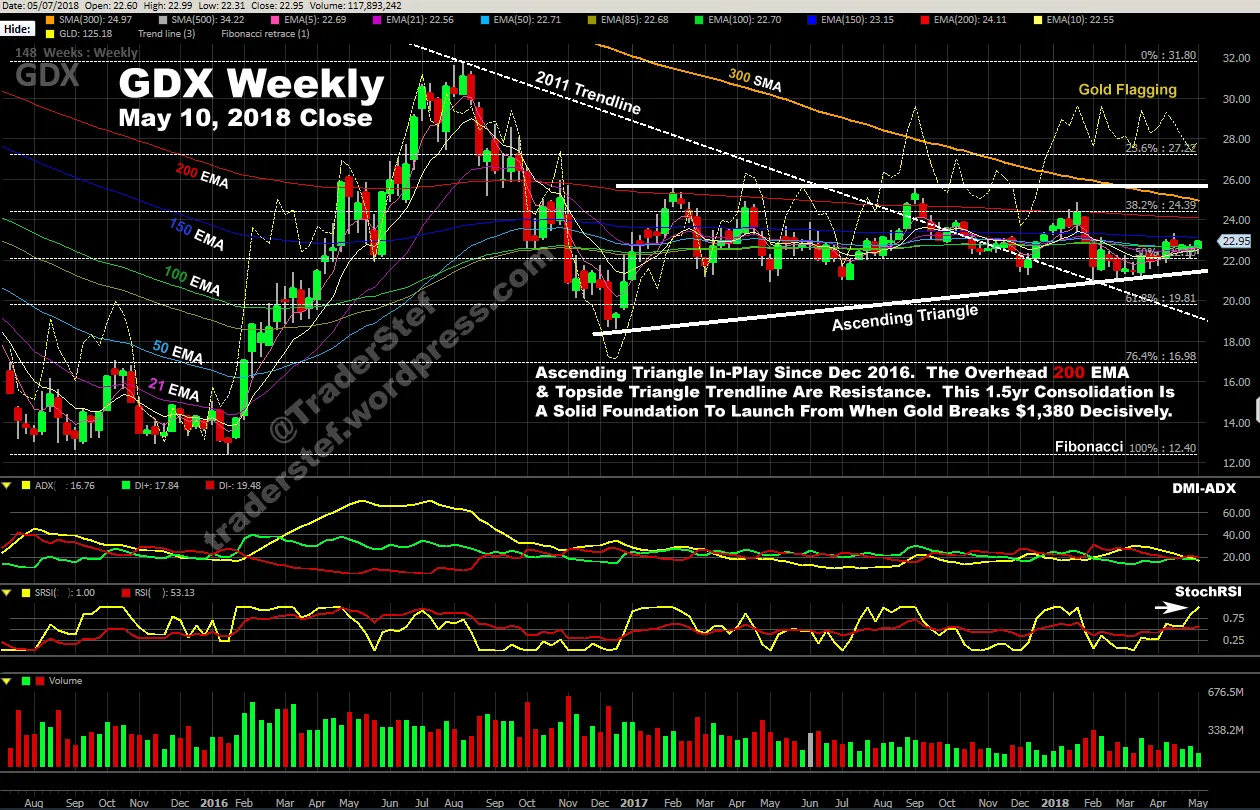
Not much has changed since Jan. 2018. I included a $GLD Gold ETF (see “gold flagging” pattern) overlay for reference. While gold has chopped along in its flagging pattern, the GDX has recently risen steadily, but slowly. The Ascending Triangle drawn back to Dec. 2016 remains in play. The trendline drawn down from the 2011 high appears to be in the rearview mirror. The overhead 200 EMA and topside trendline of the Ascending Triangle continue to be the resistance areas to watch. Note that the 38.2% Fibonacci is sitting on top of the 200EMA, and it is just below the 300 SMA, with all that just below the trendline. The 50% **Fibonacci **has been a magnet of support near $22 as buyers repeatedly buy the dips near $21. The DMI-ADX is still sloppy, with no momentum direction indicated. The StochRSI is rising just as it was during my previous analysis in January, but not toppy yet, so a price move back to the 200 EMA may be in the cards. The price took out the 50 EMA this week but held up at the 150 EMA as of today’s close. The buy volumes are slightly higher than they were in December-January, but not by much. Again, I must remain **Neutral **here until the 200 EMA is decisively taken out on volume, then follow through above the topside trendline. This 1.5-year consolidation is a solid foundation to launch from while waiting for gold to break away from $1,380.
GDXJ VanEck Vectors Junior Gold Miners ETF: full list of mining stocks in the basket as of Apr. 30.

GDXJ weekly as of May 10, 2018 close…
From my** January 12, 2018 **analysis: “This week’s closing candle is a hammer, the same as the GDX. Those candles are generally bullish, but other studies are causing me to pause.
I have to stand neutral here until the DMI-ADX improves in appearance, and I do not like the StochRSI looking toppy when other studies are not 100% in your favor. I do like that the volumes have risen slightly with price. If the overhead 150 EMA is challenged with decisive volumes, I would flip to bullish.”

The GDXJ may appear somewhat similar to the GDX, but the technicals are different while both wait for gold to make a move. The GDXJ is now in a well-defined Symmetrical Triangle. As with the GDX, while gold has chopped along in its flagging pattern, the GDXJ has risen steadily but slowly as of late. The overhead 150 EMA is the major resistance, rather than the **200 EMA **that has not been touched since the summer of 2016. Taps on the topside trendline are more consistent, with four, rather than three. The price is peeking slightly above the topside trendline this week. The trendline drawn down from the 2010 high appears to be in the rearview mirror. The 61.8% **Fibonacci **has been a solid support line since May 2017. There is a $5 spread between the current price point and overhead confluence of the 200EMA, 38.2% Fibonacci, and 300 SMA. The DMI-ADX is still sloppy, with no momentum direction indicated. The StochRSI is rising as it was during my previous analysis in January, but not toppy yet, so a price move to the 150 EMA is likely. I must remain **Neutral **here until the 150 EMA and trendline are decisively breached on volume. The price must also follow through the noted overhead confluence. Current volumes are muted. As with the GDX, the 1.5-year consolidation is a solid foundation to launch from while waiting for gold to break away from $1,380.
Plan Your Trade, Trade Your Plan
TraderStef on Twitter
Website: https://traderstef.wordpress.com